Originally Written: July 2016
Executive Summary
- In Euro 2016 games distance covered had a small positive effect on match outcomes principally through improved defence.
- There is also evidence that teams that made greater use of a short passing game created more scoring opportunities and scored more goals.
- Italy averaged the highest distance covered while Spain averaged the highest number of attempted passes. Germany ranked highly for both distance covered and attempted passes.
- Against Iceland, England dominated possession and created many more goal attempts but lost to a team that compensated by working harder in distance covered. It was a similar story in the Final where France played more but Portugal ran more.
- No playing style dominated Euro 2016 beyond pragmatic football, playing the style that best suits the players available and most likely to effective against specific opponents.
Euro 2016 is unlikely to be remembered as a great festival of football. No team really shone in the way that Spain did with their tiki-taka football style between 2008 and 2012. The headlines were made more by the underdogs most notably Iceland who made it to the quarter finals knocking out England on their way, and of course Wales who reached the semi-finals. The success of both Iceland and Wales certainly made a case for the importance of team cohesion (the subject of my next blog). But did we learn anything from Euro 2016 about the effectiveness of different playing styles? Has the relative demise of Spain seen a swing back in favour of the hard-working artisan over the possession-loving artist?
The merits or otherwise of the possession game is of course where football analytics has its origins with the pioneering work of Wing Commander Reep from the early 1950s onwards and his data-based advocacy of a direct playing style. Reep remains a controversial figure and many see him as a strong argument against the use of analytics in the beautiful game. Reep found overwhelming evidence over a lifetime of coding and analysing games that most goals scored came from possessions involving three passes or less, and inferred from this that the long-ball game was likely to be most effective. It took until 2005 for Hughes and Franks to provide the definitive analytical critique of Reep’s conclusions. Quite simply, Reep’s fallacy was to focus only on possessions with a successful outcome. Once you include all of the possessions in the analysis, not just those that ended in a goal attempt or goal scored, there is a tendency for a higher number of goal attempts and goals scored per possession, the higher the number of passes, implying the complete opposite to Reep as regards the relative merits of direct and possession-based playing styles. The ability to complete passes is a general indicator of team quality and teams that complete more passes tend to be better able to create scoring opportunities. Spain’s success with tiki-taka football was not a statistical anomaly but just confirmation par excellence of Reep’s misinterpretation of the evidence.
Of course, and not just in (association) football but in all of the invasion-territorial sports, there is no simple linear relationship between share of possession and match outcomes. It is not the quantity of possession that counts as much as the quality of the possession in terms of pitch location and how the possession is used. A similar argument can be made when it comes to distance covered. It is not the distance covered or even the amount of high-intensity work that matters as much as the usefulness of the physical effort. The amount of high-intensity work can often be inversely related to the quality of a player’s decision making. “Reading the game” (i.e. exceptional spatial awareness) can allow players to be effective with minimal physical effort. Indeed much the same can be said about defensive actions in general. Players can defend space effectively by being in the right place at the right time without actually making a defensive action in statistical terms. Tally counts of defensive actions and cumulative totals of distance covered may not necessarily reflect defensive effectiveness.
Bearing in mind the obvious limitations of tally counts of passes and total distance covered, were there any discernible patterns in the effectiveness of different playing styles by teams in Euro 2016? I have extracted the data from UEFA’s own published statistics on every game. To ensure comparability I have only used the data for normal time and excluded extra time in elimination games tied after 90 minutes. I have analysed differences across games using win-loss analysis (i.e. comparing mean differences between winning and losing performances using t tests and effect sizes) and correlation analysis across all games, as well as ranking teams by game averages, and using cluster analysis to categorise teams.
So what do the data tell us about Euro 2016? First of all there is evidence that distance covered has a small positive effect on match outcomes principally through improved defence. Across all 102 team performances the correlation between distance covered and goals conceded is -0.117. A similar effect is found between comparing winning and losing team performances. Winning teams averaged 108.2 km whereas losing teams averaged 107.2 km. Although the difference is not statistically significant, it is consistent with a small positive effect on winning (Cohen’s d = 0.249).
In the case of passing, the win-loss analysis yields a small to medium effect for the ratio of short-to-long attempted passes relative to the opposition’s ratio (Cohen’s d = 0.315). Winning teams tended to attempt proportionately more short passes than long passes compared to their opponents. Correlation analysis also picks up similar tendencies. More attempted short passes has a small positive effect on goals scored (r = 0.126) but a large positive effect on the number of goal attempts (r = 0.523). By contrast more attempted long passes has a small negative effect on both goals scored (r = -0.147) and goal attempts (r = -0.099).
Table 1 reports game averages and rankings for distance covered, total passes attempted and short passes attempted for all 24 teams. Perhaps surprisingly for some, Italy had by far the highest distance covered, averaging 114.7 km per game. The other top teams in terms of distance covered were Ukraine (112.1 km), Czech Republic (112.1 km), Germany (112.0 km) and Iceland (110.3 km). Germany also ranked highly in terms of attempted passes, both all attempted passes (638.7) and attempted short passes (141.0), second only to Spain who averaged 648.0 attempted passes with an average of 181.0 attempted short passes. England ranked third on attempted short passes (127.8) and fourth for all attempted passes (500.3). France, Portugal and Switzerland were the other most highly ranked passing teams.
Table 1: Distance Covered and Attempted Passes, Game Averages and Rankings, Normal Time Only, by Team, Euro 2016
| Team | Distance Covered (m) | Total Passes Attempted | Short Passes Attempted | |||
| Game Average | Ranking | Game Average | Ranking | Game Average | Ranking | |
| Albania | 104,744 | 20 | 350.67 | 19 | 104.67 | 12 |
| Austria | 107,116 | 15 | 456.00 | 8 | 113.00 | 8 |
| Belgium | 104,381 | 21 | 443.40 | 11 | 113.60 | 7 |
| Croatia | 107,028 | 16 | 389.75 | 15 | 91.75 | 16 |
| Czech Rep. | 112,111 | 3 | 317.00 | 21 | 83.33 | 20 |
| England | 107,859 | 12 | 500.25 | 4 | 127.75 | 3 |
| France | 106,550 | 17 | 484.86 | 5 | 119.71 | 4 |
| Germany | 111,950 | 4 | 638.67 | 2 | 141.00 | 2 |
| Hungary | 107,227 | 14 | 443.75 | 10 | 97.25 | 15 |
| Iceland | 110,305 | 5 | 259.00 | 23 | 60.60 | 23 |
| Italy | 114,656 | 1 | 408.20 | 12 | 81.60 | 21 |
| N. Ireland | 108,516 | 8 | 230.00 | 24 | 51.50 | 24 |
| Poland | 108,343 | 9 | 370.00 | 17.5 | 88.80 | 19 |
| Portugal | 107,885 | 11 | 473.86 | 6 | 117.43 | 5 |
| Rep. of Ireland | 103,192 | 24 | 279.75 | 22 | 67.25 | 22 |
| Romania | 103,311 | 23 | 346.33 | 20 | 97.33 | 14 |
| Russia | 110,014 | 6 | 462.67 | 7 | 91.67 | 17 |
| Slovakia | 108,968 | 7 | 391.50 | 14 | 107.50 | 10 |
| Spain | 107,628 | 13 | 648.00 | 1 | 181.00 | 1 |
| Sweden | 105,354 | 19 | 397.00 | 13 | 100.67 | 13 |
| Switzerland | 108,300 | 10 | 510.75 | 3 | 116.50 | 6 |
| Turkey | 104,164 | 22 | 370.00 | 17.5 | 109.00 | 9 |
| Ukraine | 112,133 | 2 | 448.67 | 9 | 106.00 | 11 |
| Wales | 105,873 | 18 | 388.83 | 16 | 89.83 | 18 |
| All | 107,923 | 424.50 | 103.40 | |||
Figure 1 provides a useful categorisation of teams based on distance covered and attempted passes using cluster analysis. What really stands out are the outliers particularly the Republic of Ireland (low distance covered, low short passes), Northern Ireland (medium distance covered, low short passes), Iceland (medium distance covered, low short passes), Italy (high distance covered, below average short passes), Spain (average distance covered, high short passes) and Germany (high distance covered, high short passes). Wales were below average on both metrics while England were average for distance covered and above average in attempted short passes.
Figure 1: Cluster Analysis of Attempted Short Passes and Distance Covered, Game Averages, Normal Time Only, by Team, Euro 2016
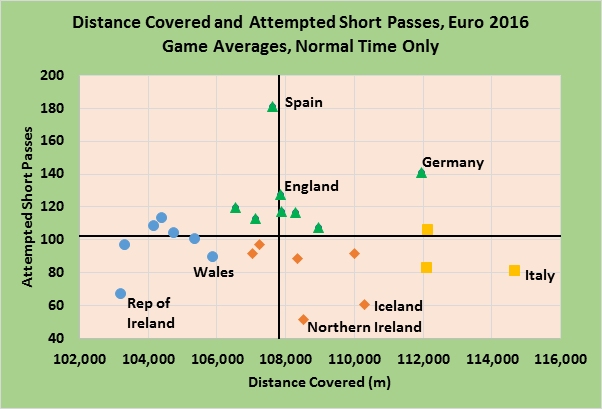
Table 2 summarises two specific games – England’s defeat by Iceland and the first 90 minutes in the Final between France and Portugal. In both games the teams that played more lost out to teams that ran more. Both England and France dominated possession, had higher pass completion rates and created more goal attempts yet failed to win. The two winning teams compensated for their lack of possession and limited goal threat by working harder in terms of distance covered. Both Iceland and Portugal covered around 4 km more than their opponents.
Table 2: England vs Iceland and France vs Portugal, Euro 2016, Selected Team Metrics, Normal Time Only
| Normal Time Only | Round of 16 | Final | ||
| England | Iceland | France | Portugal | |
| Distance Covered (m) | 105,234 | 109,147 | 105,749 | 110,206 |
| Total Passes Attempted | 525 | 243 | 585 | 461 |
| Short Passes Attempted | 121 | 59 | 105 | 117 |
| Long Passes Attempted | 68 | 61 | 46 | 63 |
| Pass Completion | 85.9% | 71.2% | 91.3% | 85.9% |
| Goal Attempts | 18 | 8 | 17 | 6 |
| Goals Scored | 1 | 2 | 0 | 0 |
Perhaps the winners of the tournament summed it up best by progressing to the Final largely on the performance of their artist supreme, Ronaldo, particularly when it mattered most. But the early loss of Ronaldo in the Final saw Portugal triumph through hard work and defensive organisation. Maybe the lesson of Euro 2016 is that no particular playing style dominated and ultimately it was a triumph of pragmatic football, playing the style that best suits the players available and most likely to be effective against the specific opponents. And one final thought with the new Premiership just around the corner – can we expect Chelsea under Conte to emulate the high work rate of his Italian team at Euro 2016?
Endnote on Methods: Cluster Analysis
Cluster analysis is an important exploratory technique that can often generate useful summary categorisations. Cluster analysis can produce very effective visualisations when clustering on two dimensions only as in the case here where I have used distance covered and attempted short passes. If the analysis involves more than two dimensions, it can sometimes be possible to use factor analysis to combine the original metrics into two factors that can then be clustered and visualised. In particular using four clusters and factor rotation can often combine to produce very neat four-quadrant categorisations that are easy to interpret. Two things to bear in mind when using cluster analysis:
- It is crucial to standardise the metrics before applying cluster analysis when you are using metrics with very different scales of measurement. In my case, distance covered would have dominated the allocation of teams to clusters if I had not converted both metrics into Z scores before applying the clustering procedure (K-Means clustering). In fact there was a 25% difference in the allocation of teams to clusters between using standardised and unstandardized metrics. Figure 1 displays the clusters in terms of the original units of measurements but the clusters were determined using Z scores.
- Cluster analysis, like so many other statistical techniques, can be susceptible to the undue influence of extreme observations (i.e. outliers). This is certainly the case in the analysis of playing styles at Euro 2016. It is always advisable to explore the effects of using different numbers of clusters as well as comparing the effects of excluding the outliers.
