Originally Written: January 2018
Executive Summary
• Performance ratios are widely used because they are easy to interpret and enhance comparability by controlling for scale effects on performance
• But performance ratios are susceptible to a number of potential problems that can seriously undermine their usefulness and even lead to misleading recommendations on how to improve performance
• The problems with performance ratios are well known in finance but are largely ignored by practitioners
• Crucially performance ratio analysis assumes that scale effects are linear
• Before using performance ratios, analysts should explore the shape of the relationship between performance and scale, and check for linearity
• If the performance relationship is non-linear, group performances by scale and use appropriate scale-specific benchmarks for each group
• Remember effective performance ratio analysis is always trying to compare like with like
It is very common for KPIs to be formulated as performance ratios. The reason for this is very simple. Ratios can enhance comparability when there are significant scale effects. For example, it tells us very little if we compare the total activity levels of two players with very different amounts of game time. We would naturally expect that players with more game time will tend to do more. In this situation it makes more sense to control for game time and compare instead activity levels per minute played.

As well as controlling for scale effects on performance levels, ratios can also control for size effects on the degree of dispersion which can create problems for more sophisticated statistical modelling such as regression (the so-called heteroscedasticity problem).
However, despite the very widespread use of performance ratios, there are a number of potential problems with using ratios, some of which can seriously affect the validity of any conclusions drawn about performance and even lead to misleading recommendations on interventions to improve performance. The problems with performance ratios are well known in finance where financial ratio analysis is the standard method for analysing the financial performance of businesses. Hence I believe that there are lessons to be learnt from financial ratio analysis that can be applied to improve the use of performance ratios in sport.
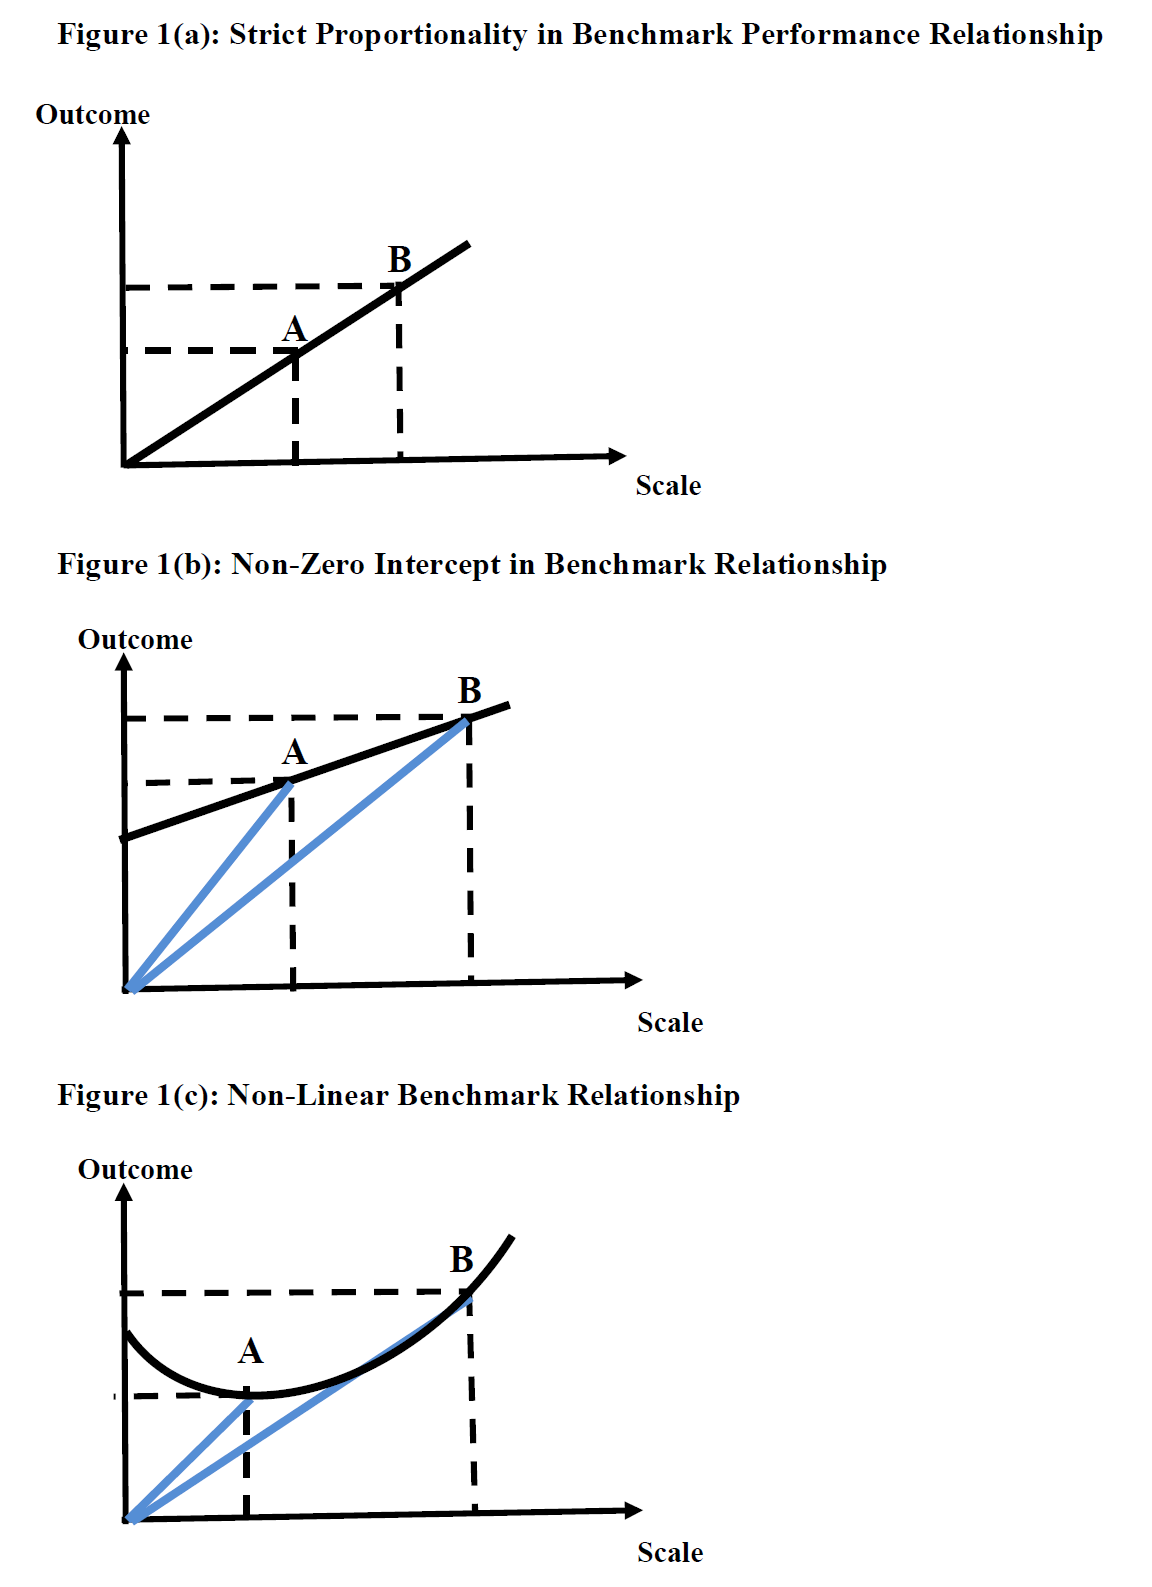
One of the key messages in the debates on the use of performance ratios in finance is the importance of recognising that ratio analysis implies strict proportionality. What this means is best explained diagrammatically. Suppose that we want to compare two performances, A and B, where B is a performance associated with a larger scale. Suppose also that we know the expected (or benchmark) relationship between scale and outcome and that both of the observed performances lie on the benchmark relationship. In this case performance ratio analysis would be useful only if the outcome-to-scale ratio is equal for A and B. Graphically the outcome-to-scale ratio represents the slope of the line from the origin to the performance point. It follows that A and B can only have the same performance ratio if they both lie on the same line from the origin. This is strict proportionality and is shown in Figure 1(a). Comparing performance ratios against a single benchmark ratio value presupposes that the scale-outcome relationship is linear with a zero intercept. If either of these assumptions does not hold, then it is no longer valid to draw conclusions about performance by comparing performance ratios. This is a really important point but ignored by the vast majority of users of performance ratios.
The problems of non-zero intercepts and non-linear relationships are illustrated in Figures 1(b) and 1(c). In both cases A and B are on the benchmark relationship but their performance ratios (represented by the slopes of the blue lines) differ. In these cases performances ratios become much more difficult to interpret. It is no longer necessarily the case that differences between performance ratios can be interpreted as deviations from the benchmark, implying better/worse performance after controlling for scale effects. Effectively the problem is that the scale effects have not been fully controlled so that differences in performance ratios are still partly reflecting scale effects on performance.
So what is to be done? It becomes even more important to undertake exploratory data analysis to understand the shape of the relationship between performance and the relevant scale measure. At the very least you should always plot a scatter graph of performance against scale. If it looks as if there a non-zero intercept (i.e. there is a non-scale-related component in performance), then re-calculate the performance ratio using the deviation of performance from the non-zero intercept. If the performance relationship looks to be non-linear, then categorise your performances into different scale classes and use a range of values for the benchmark ratio appropriate for different scales. For example, in association football, the number of passes is often used as a scale measure for performance ratios. But we would expect very different ratio values for teams playing a possession-based, tiki-taka passing style compared to teams adopting a more direct style. Unless the underlying benchmark relationships exhibit strict proportionality, different benchmarks should be used to evaluate the performances of possession-based teams and direct-play teams. Always try to compare like with like.
There are two other statistical problems with ratio analysis that should also be noted. First, if the same scale measure is used in several performance ratios, this can influence the degree of association between the ratios. It is called the spurious correlation problem and was first identified in the late 19th Century in studies of evolutionary biology. Using common denominators in ratios can create the appearance of a much stronger relationship between different aspects of performance than there actually exists. In some circumstances common denominators can obscure the degree of relationship between different aspects of performance. Another statistical problem with ratio analysis is that ratios can exaggerate the degree of variation as the denominator gets close to zero and the ratio becomes very large. It is crucial to be aware of these outliers since they can have undue influence on the results of any statistical analysis of the performance ratios.
Some researchers in finance have recommended abandoning financial ratio analysis and using regression analysis. But regression analysis brings its own methodological issues and is not always applicable. It also ignores the reasons for the widespread use of performance ratios, mainly their simplicity. What is needed is better use and better interpretation of performance ratios informed by an awareness of the potential problems. In addition, we need to use performance ratio analysis in a more systematic fashion which is the subject of my next post.
