Originally Written: January 2018
Executive Summary
-Practitioners are often criticised for using performance ratios in a very piecemeal and fragmented fashion
-The problem is often compounded by more holistic approaches such as the balanced scorecard which encourages reporting of a very diversified set of performance metrics often with little understanding of their interdependencies and links to strategic goals
-The structured hierarchy approach provides a systematic framework for the forensic investigation of performance trends and benchmark comparisons
-The structured hierarchy approach can use a formalised mathematical structure but this is not necessary nor may it be appropriate in some contexts
-The structured hierarchy approach requires that the analyst has a clear understanding of the overall structure of the process being analysed and of how the performance ratios are related to the various components of the process
-Statistically significant differences between ratios at one level are not necessarily evident at other levels
As well as ignoring the various statistical and other methodological issues with performance ratio analysis, another strand of criticism directed at practitioners has been the tendency to use performance ratios in a very piecemeal and fragmented fashion. Again this has been a very common criticism of financial ratio analysis. And in some ways the problem was made worse by another criticism that there is too much emphasis on financial performance in assessing business performance. This led to Kaplan and Norton proposing the balanced scorecard approach in which four dimensions of business performance are identified – financial, customer, business processes, and learning and growth – with businesses encouraged to monitor a set of KPIs for each dimension. Although the need for a more holistic approach to performance is well taken, in practice the balanced scorecard approach has just compounded the problem by leading to a greater range of performance metrics being reported but still used in a very piecemeal and fragmented fashion. Ittner and Larckner, in particular, have been very critical of the balanced scorecard approach, arguing that the performance metrics are seldom linked to the strategic goals of a business, the supposed links between the metrics and overall performance are not validated and tend to be more articles of faith than evidence-based, and, as a consequence, the balanced scorecard does not lead to the right performance targets being set.
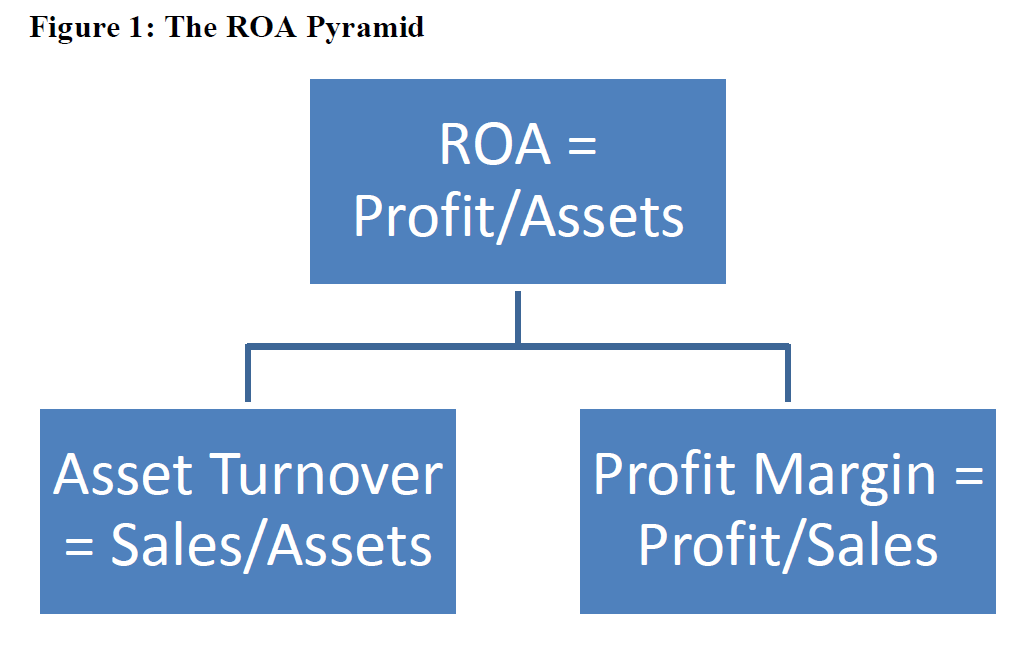
But again the problem of a fragmented approach to performance ratio analysis has been recognised in finance and a more structured approach has been adopted by some and often referred to as the Du Pont system recognising the chemical conglomerate that first popularised the approach. Others have called it the pyramid-of-ratios approach. The basic idea is to take an overall performance ratio and then decompose it into constituent ratios. For example, the return on assets (ROA) is calculated as the ratio of profits to assets. ROA can be decomposed into two constituent ratios – asset turnover (= sales/assets) and profit margin (= profit/sales). These two ratios capture the two fundamentals of any business – the ability to “sweat the assets” to generate sales (as measured by asset turnover) and the ability to extract profit from sales (measured by the profit margin). So if you want to understand changes in a company’s ROA over time or you want to explain the difference in ROA between companies, you can use this structured approach to determine whether the changes/differences in ROA are due mainly to changes/differences in asset turnover which reflects external market conditions, or changes/differences in the profit margin which reflects internal production conditions. The simple ROA pyramid is summarised in Figure 1. It can be extended in both directions, upwards by relating ROA to other rates of return, and downwards by further decomposing asset turnover and profit margin.
Figure 1: The ROA Pyramid
The Du Pont/pyramid-of-ratios approach is an example of what I call the structured hierarchy approach and provides a systematic framework for the forensic investigation of performance trends and benchmark comparisons. In particular the hierarchical structure facilitates a more efficient analysis of performance by first identifying which aspects of performance primarily account for the differences/changes in performance overall and then tunnelling down into those specific aspects of performance in more detail.
Although the structured hierarchy approach as applied in financial performance analysis often uses a multiplicative decomposition in which performance ratios are decomposed into a sequence (or “chain”) of ratios, the product of which equals the higher-level ratio, there is no need to impose such a formalised mathematical structure. You don’t need to adopt a “one-size-fits-all” approach to creating a structured hierarchy. Multiplicative decomposition is particularly useful when dealing with processes that can be broken down into a sequence of sub-processes in which the output of one sub-process provides the input for the next sub-process in the sequence. In some cases it might be more useful to apply a linear decomposition in which a ratio is broken down into the sum of a set of constituent ratios. Linear decomposition is useful when a higher-level performance ratio depends of two or more activities that are separable and relatively independent of each other. But in many cases the structured hierarchy approach is best seen as a much more informal structure without any specific mathematical structure imposed on the relationships between performance ratios. The key point is that the structured hierarchy approach requires a clear understanding of the overall structure of the process being analysed and of how the performance ratios are related to the various components of the process.

Most of my work is in the invasion-territorial team sports mainly (association) football and rugby union. When putting together a system of KPIs to track performance, I always adopt a structured hierarchy approach. The approach is quite generic across both sports as I have summarised in Figure 2. The win percentage depends on the score difference between scores made and scores conceded (a linear decomposition). Typically these performance metrics are reported as game averages to facilitate comparisons between teams and over time. Scores made represents attacking effectiveness and naturally leads you to tunnel down into the different aspects of attacking play. In football I tend to separate attacking play into three dimensions – passing, other attacking play (e.g. crosses and dribbles), and shooting. When it comes to scores conceded I tend to separate this into exit play and defence. Exit play is a familiar term in rugby union but little used in football. Working across these sports I am particularly interested in their tactical commonalities especially the territorial dimension. I plan to post in more detail on this in the near future. But suffice to say at the moment that my experience working in rugby union particularly with Brendan Venter has made me even more acutely aware of the importance of play in possession deep in your own half. Lose possession there and you are going to cause yourself trouble. It’s what I call a SIW (self-inflicted wound). The same tactical considerations are equally applicable in football and underpin the use of a deep pressing game to maximise the number of times opponents can be pressurised into losing possession deep in their own half. A pressing game is all about reducing the effectiveness of opposition exit play. As I said I will pursue this line of thinking in more detail in a subsequent post.
Figure 2: A Generic Structured Hierarchy Approach for Invasion-Territorial Sports

One final point to bear in mind when working with performance ratios as a structured hierarchy. Statistically significant differences between ratios at one level are not necessarily evident at other levels. Again this is a problem that has bedevilled research in financial performance analysis. For example, research on the impact of location on business performance usually found significant differences in profitability between urban and rural locations but the urban-rural differences were often no longer statistically significant when profitability was decomposed. But just because there are statistical differences in ratios at one level in a structured hierarchy does not in any way imply that these statistical differences should be observed at other levels. One sporting example of this is the score difference. By definition if you analyse differences between winning and losing performances, the score difference will always be statistically significant – positive when a team wins, negative when a team loses. However when you break this down for individual teams it does not always follow that there are statistically significant differences in scores made and scores conceded. For some teams winning and losing is much more about the variation in their attacking effectiveness than the effectiveness of their exit play or defence. So in a win-loss analysis these teams will tend to have statistically significant differences in scores made but not in scores conceded. It can go the other way for teams where defensive effectiveness is the crucial performance differentiator.
