Executive Summary
-The Pythagorean expected-wins model provides a very simple predictor of team win% in baseball using squared scores
-Predictive accuracy can be improved by slightly adjusting the model
-The Pythagorean expected-wins model should be a key component in the strategic planning of the team roster and evaluating the sporting “bottom line” of any player trade-
-The Pythagorean expected-wins model can be applied to other team sports but typically requires using different powers depending on the average number of scores and the average winning margin
-The Pythagorean expected-wins model can be applied in soccer with appropriate adjustments to allow for tied games but goal difference remains the best simple score-based predictor of league performance
-Ultimately what is transferable from baseball across all pro team sports is not the specifics of the Pythagorean expected-wins model but rather the discipline of projecting the expected performance gains from any significant player recruitment decision
Pythagorean Expected Wins
Of all of Bill James’s many contributions to sabermetrics, probably the best known particularly outside baseball is his notion of Pythagorean win expectation. It is a very simple idea – league performance over a season will be closely associated with total scores made and total scores conceded. James’s innovative insight from his extensive study of baseball data was that the relationship between team win%, runs scored (RS) and runs allowed (RA) followed a power relationship:
Win%=〖RS〗^2/(〖RS〗^2+〖RA〗^2 )
As an example, Pythagorean win expectation applied to the 2014 MLB regular season yields the following results:
Table 1: MLB Regular Season 2014

Pythagorean win% works pretty well in predicting the actual win% as I have tried to highlight using conditional formatting – the colour coding matches up pretty closely but with some important exceptions discussed below.
Using Expected Wins as a Strategic Tool
There are a couple of practical uses of Pythagorean expected wins. The first and by far the most important is that it provides a key relationship to be considered when planning changes to a team roster. Pythagorean expected wins can be used to project the likely impact on the team win% of a series of player trades. It is a great discipline for GMs and Personnel Directors to formalise exactly what they expect a new recruit to bring to the team. What is the sporting “bottom line” of any trade?
Suppose you were acting as an advisor to the Milwaukee Brewers at the end of the 2014 season. The 2014 Brewers were the epitome of an average team certainly statistically. The MLB team average for total runs scored and allowed that season was 659; the Brewers scored 650 runs and allowed 657 runs, finishing with 82 wins and 80 losses to yield an actual win% of 0.506. The Pythagorean formula would have predicted 80 wins (i.e. Pythagorean win% = 0.495). If you had wanted to transform the 2014 Brewers into a team capable of competing for the World Series, you would have needed to target a regular-season win% of around 0.600 which represents 97 wins. To achieve this level of performance would require an improvement in hitting and pitching of approximately 10% to 715 runs scored and 591 runs allowed.
Win%=〖715〗^2/(〖715〗^2+〖591〗^2 )=0.594=>96 wins (= .594 x 162 games)
Of course an equal 10% improvement in hitting and pitching is just one scenario. If you look at the LA Angels with the best win% in the 2014 regular season at 0.605, this was achieved principally by their hitting strength with 773 runs scored (17.3% better than the MLB average). The Angels allowed 630 runs which was only 4.4% better than the MLB average.
Achieving that magnitude of performance improvement is a tall order for any organisation and would require a strategic plan over a number of seasons involving player trading, draft picks, player development and financial planning. But the key point is that James’s formula helps formalise the task more precisely and provides a means of evaluating how alternative courses of action could contribute to the strategic goal of the organisation.
Benchmarking with Expected Wins: Altitude Effects in Denver, Loss of Form in Oakland
Another application of Pythagorean expected wins is as a useful benchmarking device to identify large anomalies between actual win% and predicted win%. Two such anomalies stand out in the 2014 data. The Colorado Rockies had an actual win% of only 0.407, the 2nd lowest, but their Pythagorean win% was significantly higher at 0.460. This deviation is largely due to the impact of the Rockies playing their home games at altitude in Denver. Games involving the Rockies that season averaged 19.1% more runs than the MLB average.
The other big anomaly that season were the Oakland A’s and shows the effect of an extremely inconsistent season. The A’s had a league-best 59 wins and 36 losses at the All-Stars break (win% = 0.621) and still led the Angels in the AL West in early August (9th Aug: 72 wins, 44 losses, win% = 0.621) but thereafter their season collapsed with the A’s losing 30 of their last 46 games and only scraping into the post-season Wild Card game by winning their final regular-season game. But the A’s had been so good in the first two-thirds of the season that their season totals of runs scored and runs allowed still predicted that they should have had the best win% rather than finishing 10 games behind the Angels, their divisional rivals.
Do Squares Yield The Best Predictor?
James’s Pythagorean expected-win model has stood the test of time as a very useful and accurate predictor but its accuracy can be improved upon by adjusting the Pythagorean parameter (i.e. power used). In the case of the 2014 regular season, predictive accuracy can be improved by using 1.810 (based on minimising total squared deviations). This is in line with various other studies such as Kaplan and Rich in 2017* who found that the best fit in individual seasons 2007 – 2016 varied from a minimum of 1.63 to a maximum of 1.96. (Kaplan and Rich’s method gives a Pythagorean parameter of 1.79 for the 2014 season which is very close to my own findings.) All of which goes to confirm that James’s original insight back in the 1970s still remains a very good approximation to MLB reality 40 years later.
Does the Pythagorean Expected-Wins Model Apply to Other Team Sports?
There have been attempts to apply James’s model to other team sports. Kaplan and Rich in their study report results for 2007 – 2016 for the other Major Leagues. They found that the NFL (American Football) and NHL (ice hockey) also work well using squared scores although the expected-wins model works better in the NFL using a Pythagorean parameter around 2.8. Predictive accuracy in the NBA (basketball) requires a parameter in the range 12 – 14. Kaplan and Rich show that the differences in the Pythagorean parameter across sports depend on the average score per game and the average winning margin.
And what about (association) football? The first complication is that football allows for tied games. It is not unusual for 20% – 25% of games to finish tied. This is further complicated by football’s 3-1-0 points system. I have found that the most useful way to apply the Pythagorean expected-wins model in European football is to treat tied games as “half-wins” for the purpose of calculating team win%. The alternative is to use the points percentage (i.e. total league points as a proportion of the maximum attainable). However typically you find that even with the adjustment for tied games, squared scores do not predict very well at the extremes. Table 2 provides a good example of the problem using the FA Premier League for 2013/14. Using squared goals massively over-predicts the win% of the top three teams and under-predicts the win% of the bottom three.
Table 2: FA Premier League, England, 2013/14
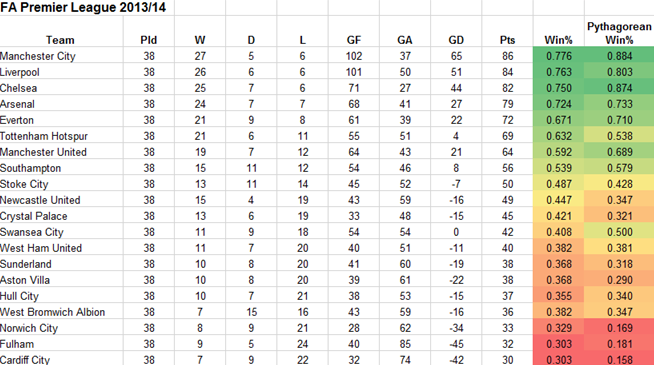
Predictive accuracy in European football is much improved by using a Pythagorean parameter much closer to unity. Using the method of minimising total squared deviations I find that 1.232 works best for the FA Premier League that season. A Pythagorean parameter close to unity in European football fits with the common finding that goal difference is the best simple score-based predictor of league performance. So there really is no need to complicate things; in football just use goal difference to predict league performance.
The Bottom Line
Ultimately what is transferable from MLB across all team sports is not the specifics of the Pythagorean expected-wins model per se. Rather it is the discipline of projecting the expected performance gains from any significant player recruitment decision. Given the size of the financial commitments involved in the salary, acquisition and development costs of elite players, it is only rational to try to project the expected benefits. Some will argue that sport is different and that the expected impact of a new player cannot be quantified. But as soon as you have signed the contract, you have quantified the value of that player financially irrespective of whether or not you believe sport is different. Costs are costs in sport as in business. Where sport differs is in the resistance of some to subjecting their expectations of performance gains to due diligence. You would expect the financial director to subject other major investment by your organisation to proper due diligence using project appraisal techniques. So why not adopt the same logic to sporting investments? That ultimately was the whole point of the Moneyball story which popularised the strategic possibilities for the Pythagorean expected-wins model.
*Edward H. Kaplan and Candler Rich, ‘Decomposing Pythagoras’, Journal of Quantitative Analysis of Sports, vol. 13, no. 4 (2017), pp. 141- 149.
