Executive Summary
- Financial determinism in pro team sports is the basic proposition that the financial power to acquire top playing talent determines sporting performance (sport’s “ law of gravity”)
- The Oakland A’s under Billy Beane have consistently defied the law of gravity for over a quarter of a century by using a “David strategy” of continuous innovation based on data analytics and creativity
Financial determinism in pro team sports is the basic proposition that sporting performance is largely determined by the financial power of a team to acquire top playing talent. This gives rise to sport’s equivalent of the law of gravity – teams will tend to perform on the field in line with their expenditure on playing talent relative to other teams in the league. The biggest spenders will tend to finish towards the top of the league; the lowest spenders will tend to finish towards the bottom of the league. A team may occasionally defy the law of gravity – Leicester City winning the English Premier League in 2016 is the most famous recent example – but such extreme cases of beating the odds are rare.
Governing bodies tend to be very concerned about financial determinism since it can undermine the uncertainty of outcome – sport, after all, is unscripted drama where no one knows the outcome in advance. It is a fundamental tenet of sports economics that uncertainty of outcome is a necessary requirement for spectator interest and the financial stability of pro sports leagues. Hence why governing bodies have actively intervened over the years to try to maintain competitive balance with revenue-sharing arrangements (e.g. shared gate receipts and collective selling of media rights) and player labour market regulations (e.g. salary caps and player drafts). And financial determinism creates the danger that teams without rich owners will incur unsustainable levels of debt in pursuit of the dream of sporting success and eventually collapse into bankruptcy (as Leeds United fans know only too well given their experience in the early 2000s).
Major League Baseball (MLB), like the other North American Major Leagues, have actively intervened in the player labour market via salary caps, luxury taxes on excessive spending and a player draft system to try to reduce the disparity between teams in the distribution of playing talent. But financial determinism is still strong in the MLB as can be seen in Figure 1 which shows the average win rank and average wage rank of the 30 MLB team over the 26-year period, 1998 – 2023 (1998 was Billy Beane’s first season as GM at the Oakland A’s). There is a very strong correlation between player wage expenditure and regular-season win percentage (r = 0.691). The three biggest spenders – New York Yankees, Boston Red Sox and LA Dodgers – have been amongst the five most successful teams over the period with the New York Yankees topping both charts (with an average win rank of 5.8 and an average wage rank 1.8).
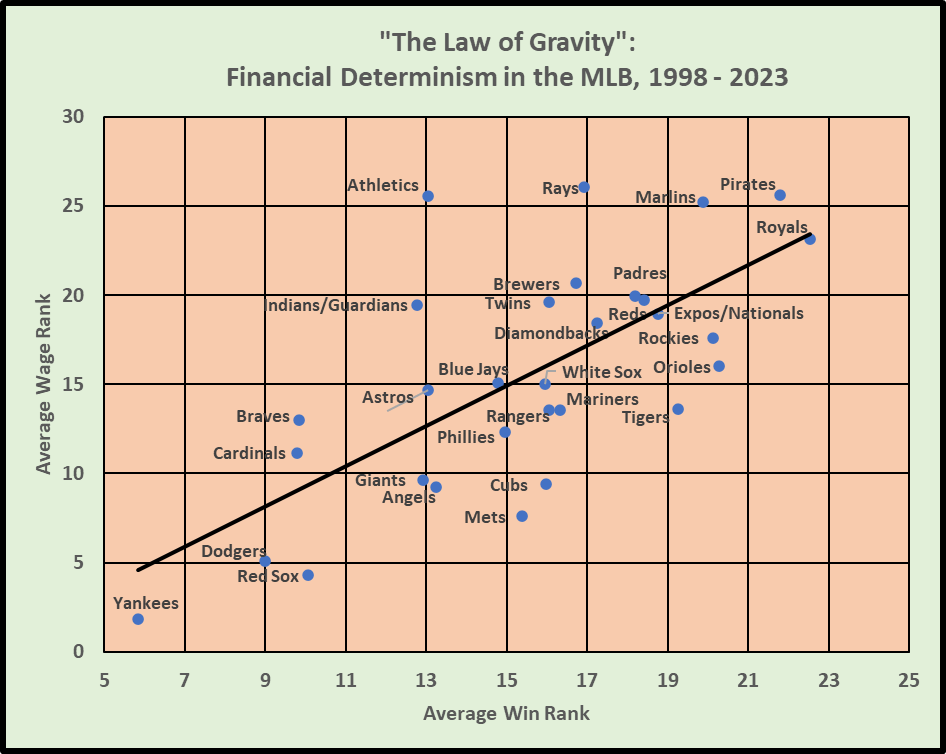
The standout team in defying the law of gravity are Oakland A’s. Over a 26-year period, their average wage rank has been 25.5 but their average win rank has been 13.0 which gives a rank gap of 12.5. Put another way, the A’s have had the 3rd lowest average wage rank over the last 26 years but are in the top ten in terms of their average win rank. Looking at Figure 1, the obvious benchmarks for the A’s in spending terms are Tampa Bay Rays, Miami Marlins and Pittsburgh Pirates but all of these teams have had much poorer sporting performance than the A’s. Indeed in terms of sporting performance as measured by average win rank, the A’s peers are LA Angels, their Bay Area rivals, San Francisco Giants, Houston Astros and Cleveland Guardians (formerly Cleveland Indians) but all of these teams have had much higher levels of expenditure on player salaries.
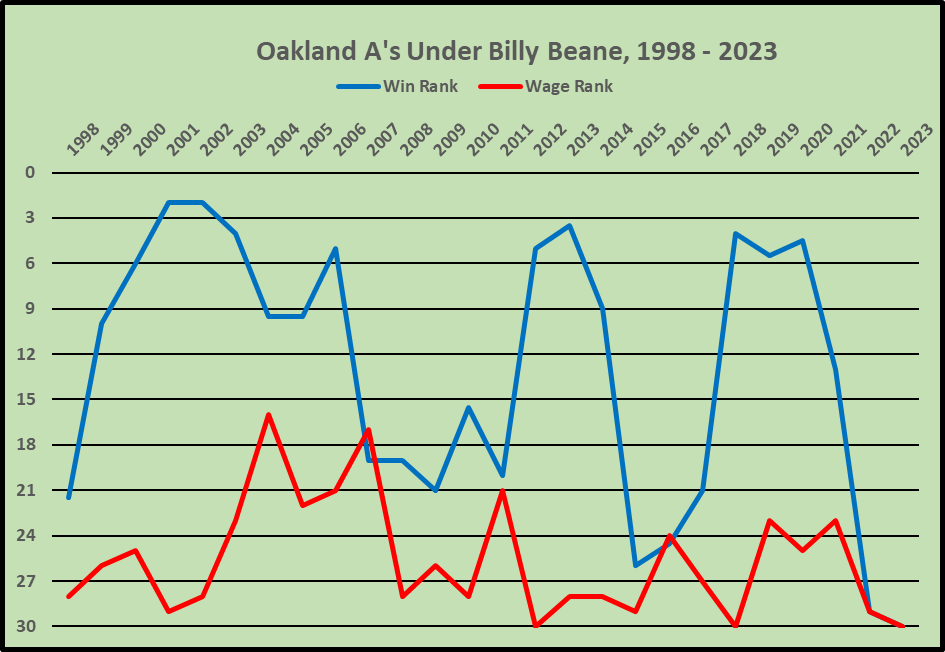
Figure 2 details the year-to-year record of the A’s over the whole period of Billy Bean’s tenure as GM then Executive Vice President for Baseball Operations. As can be seen, the A’s have consistently been amongst the lowest spenders in the MLB and, indeed, there are only two years (2004 and 2007) when they were not in the bottom third. The regular-season win percentage has been rather cyclical with peaks in 2001/2002, 2006, 2012/2013 and 2018/2019. The 2001 and 2002 seasons are the “Moneyball Years” covered by Michel Lewis in the book when the A’s had the 2nd best win percentage in both seasons. As discussed in Part One of this post, the efficient market hypothesis (EMH) in economics suggests that any competitive advantage based on inefficient use of information by other traders will quickly evaporate when the informational inefficiencies become widely recognised. Hence, the EMH implies that the A’s initial success would be short-lived and other teams would soon “catch up” and start to use similar player metrics as the A’s. Which is exactly what happened. In fact, Moneyball led all other MLB teams to start using data analytics more extensively, some more than others. This is what makes the A’s experience so unique – other teams imitated the A’s in their use of data analytics and developed their own specific data-based strategies but still the A’s kept punching well above their financial weight and making it to the post-season playoffs on several occasions. This suggests that the A’s have been highly innovative in developing analytics-based David strategies which have informed both their international recruitment and player development in their farm system. Just as in the Land of the Red Queen in Alice in Wonderland, so too in elite sport when competing with analytics, you’ve got to keep running to stay still.
Success = Analytics + Creativity.
Read Other Related Posts

3 thoughts on “Moneyball: Twenty Years On – Part Two”