As discussed in the two previous posts on competitive balance, there is no agreed single definition of competitive balance beyond a general statement that a competitively balanced league is characterised by all teams having a relatively equal chance of winning individual games and the league championship. The lack of agreement on a specific definition of competitive balance combined with the wide variety of league structures and the statistical problems of inferring ex ante (i.e. pre-event) success probabilities from ex post (i.e. actual) league outcomes has led to a multiplicity of competitive balance metrics. Morten Kringstad and I have argued in several published journal articles and book chapters that it is useful to categorise competitive balance metrics as either measures of win dispersion or performance persistence. Win dispersion measures the dispersion in league performance across teams in a particular season. Performance persistence measures the degree to which the league performance of individual teams is replicated across seasons – do teams tend to finish in the same league position in consecutive seasons? These are two quite different aspects of competitive balance and multiple metrics have been proposed for both. However, when it comes to discussions as to what leagues should do, if anything, to maintain or improve of competitive balance, there is a general (often implicit) presumption that all competitive balance metrics tend to move in the same direction. Morten and I have sought to discover if this is indeed the case. And, as reported in my previous post on the subject, the evidence from European football is quite mixed and, at the very least, casts doubt on the general presumption that there is a strong positive relationship between win dispersion and persistence. Indeed, we found that in the period 2008 – 2017 win dispersion and performance persistence tended to move in opposite directions in the English Premier League.
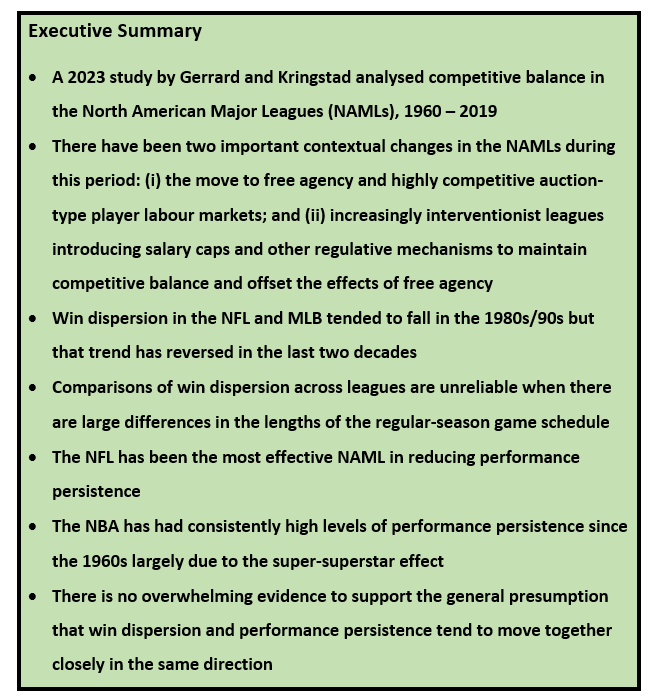
In this post, I am going to discuss the evidence from a study on win dispersion and performance persistence in the four North American Major Leagues (NAMLs) that Morten and I published recently in Sport, Business, Management: An International Journal (vol 13 no. 5, 2023). Our dataset covered the four NAMLs – MLB (baseball), NFL (American football), NBA (basketball) and NHL (ice hockey) – seven different competitive balance metrics, and 60 seasons, 1960 – 2019 (thereby avoiding the impact of the Covid pandemic). In this post I am only focusing on the ASD* measure of win dispersion, the SRCC measure of performance persistence, and the correlation between these measures to test whether or not win dispersion and performance persistence move together in the same direction. I have reported these three measures as 10-year averages in order to identify possible trends over time. It is agreed that the ASD* metric provides better comparability of win dispersion between leagues with very different lengths of game schedules in the regular season. At one extreme the MLB has a 162-game schedule whereas for most of the period the NFL had a 16-game regular season schedule (recently increased to 17 games). The ASD* uses the actual standard deviation of team win percentages relative to the theoretical standard deviation of a perfectly dominated league with the same number of teams and games in which every team loses against the teams ranked above it so the top team wins every game, the second best team only loses against the top team, the 3rd-placed team only loses against the top two and so on. (Formally, this is called a “cascade” distribution.) The SRCC measure of performance persistence is just the Spearman rank correlation coefficient of league standings in two consecutive seasons.
One important contextual change in most leagues since the 1960s has been the move away from a very restricted player labour market in which a player’s current team had priority in retaining a player. Instead player labour markets have become a very competitive auction-type market in which players have the right to move to another team at the end of their current contract (what is known as “free agency”). The NAML’s led the way in pro team sports in introducing some form of free agency in the 1970s/80s. European leagues lagged behind until the Bosman ruling in 1995 which effectively created free agency by abolishing transfer fees for out-of-contract players. So in some ways it should be expected that the general trend in the NAMLs has been towards greater competitive imbalance as the big-market teams have taken advantage of free agency to acquire the best players. However, there has been another general tendency with leagues becoming much more interventionist by introducing regulatory mechanisms especially salary caps which, in part, has been motivated by an attempt to offset the potential negative effect on competitive balance of free agency. Which effect has been stronger? Let’s look at the numbers.
Table 1 below reports the 10-year averages for win dispersion for the four NAMLs. Broadly speaking, the pattern in win dispersion in the NAMLs over the last 60 years has been for win dispersion to decrease from the 1960s though to the 1990s (i.e. improved competitive balance) but for win dispersion to increase since the 1990s (i.e. reduced competitive balance). Both the MLB and NFL follow this pattern, suggesting that the league intervention effect may have initially dominated the free agency effect but in recent years the resource-richer teams may have adapted to the more regulated environment and found other ways to exert their financial advantage (while remaining compliant with league regulations) such as higher expenditures on technology and data analytics. I used to argue that the Oakland A’s and the Moneyball phenomenon is an example of data analytics being used as a “David” strategy for resource-poorer teams to compete more effectively. And it is true that in the early days of sports analytics it was often the resource-poorer teams that led the way in operationalising data analytics as a source of competitive advantage. But these days most teams recognise the potential gains from analytics and some very resource-rich teams are investing heavily in data analytics.
The trends in win dispersion are much less clear in both the NBA and NHL. There has been some underlying trend from the 1960s onwards for competitive balance to worsen in the NBA as win dispersion has increased. In contrast, the NHL has tended to experience an improvement in competitive balance with lower win dispersion since the turn of the century.

When win dispersion across the four NAMLs are compared, there is a rather surprising result that the NFL has the highest degree of win dispersion over the whole period (i.e. low competitive balance) whereas the MLB has the lowest win dispersion (i.e. high competitive balance) with the NBA and NHL in the mid-range. I say surprising since conventional wisdom is that NFL has been one of the most proactive leagues in trying to maintain a high level of competitive balance whereas traditionally the MLB has been much less interventionist. The problem in making comparisons across leagues especially in different sports is the “apples-and-oranges” problem – trying to compare like with like. As highlighted earlier, there are massive differences between the NAMLs in the length of regular-season game schedules. I am more inclined to the view that the difference in win dispersion between the NAMLs is more a reflection of the difficulties in constructing a metric that properly controls for the length of game schedules, that is, it is more a measurement problem than a “true” reflection of differences in competitive balance.
The argument that win dispersion metrics can pick up trends within leagues but is less reliable for comparisons across leagues is reinforced by the results for performance persistence reported below in Table 2. Performance persistence measures the degree to which the final standings of teams are replicated in consecutive seasons. The length of game schedule has a much more indirect effect on performance persistence so that comparisons across leagues should be more reliable. And, indeed, we find that from the 1980s onwards the NFL has had the lowest degree of performance persistence which fits with the conventional view that the NFL has been the most proactive league in maintaining a high degree of competitive balance. Winning NFL teams face a number of “penalties” in the next season – tougher game schedules, lower-ranked draft picks and the constraints imposed by the salary cap in retaining free agents who have increased in value by virtue of their on-the-field success. It is more and more difficult for NFL teams to become “dynasty” teams which makes the Belichick-Brady era at the New England Patriots and, most recently, the success of the Kansas City Chiefs so remarkable.
As well as the NFL, the other NAML that has managed to reduce the degree of performance persistence is the NHL which had the highest degree of performance persistence in the 1960s and 1970s but now ranks second best behind the NFL. The MLB experienced reduced performance persistence in the 1980s and 1990s ( and had, on average, lower performance persistence than the NFL in the 1990s) but that downward trend has been reversed in the last two decades. The one major league that has had no discernible trend in performance persistence over the last 60 years and has the highest degree of performance persistence is the NBA despite instituting a salary cap albeit a rather “soft” cap with a number of exemptions. The high performance persistence of basketball teams is inherent in the very structure of the game. With only five players on court for a team at any point in time, basketball is much more susceptible to the “Michael Jordan” (i.e. “super-superstar”) effect and the soft salary cap makes it easier to retain these super-superstars.

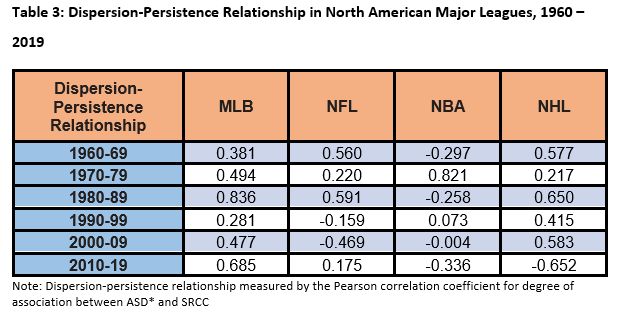
The final set of results reported in Table 3 show how the relationship between win dispersion and performance persistence has varied over time and between leagues. One of the main motivations for this research is to determine whether or not the general presumption of a strong positive dispersion-persistence relationship is empirically valid. The evidence is mixed. There are only eight instances of a strong positive dispersion-persistence relationship (r > 0.5) out of a possible 24 which is hardly overwhelming evidence in favour of the general presumption. If medium-sized effects are included (0.3 < r < 0.5) then only half of the reported results provide support for the general presumption of a positive relationship with three strong/medium negative results and nine showing only small/negligible effects. There is one instance of a strong negative dispersion-persistence relationship in the NHL in 2010-19 indicating that reductions in performance persistence were associated with increases in win dispersion.
Competitive balance in the NAMLs has been much researched over the last 30 years. The results of our study are broadly in line with previous results but highlight that any conclusions are likely to be time-dependent and metric-dependent. The most definitive results are those on performance persistence which show a general tendency in both the NFL and NHL for improved competitive balance despite the advent of free agency. There is also clear evidence of continuing high levels of performance persistence in the NBA, likely to be due to the super-superstar effect inherent in the game structure of basketball. As for the general presumption that win dispersion and performance persistence tend to move together in the same direction, there is no overwhelming support that they do so in most cases. The practical implication is that leagues need to be clearer on which aspect of competitive balance is most important in driving uncertainty of outcome and spectator/viewer interest. Leagues must also recognise that the structures of their sports may limit the extent to which competitive balance can be regulated. Basketball is always likely to more susceptible to super-superstar effects that can lead to high levels of performance persistence. And leagues with short game schedules may always tend to have higher levels of win dispersion since there is more limited opportunity for winning or losing streaks to even themselves out – what statisticians call the “regression-to-the-mean” effect.
Other Related Posts
Competitive Balance Part 1: What Are The Issues?
Competitive Balance Part 2: European Football
Note: The results reported in this post are published in B. Gerrard and M. Kringstad, ‘Dispersion and persistence in the competitive balance of North American Major Leagues 1960 – 2019‘, Sport, Business, Management: An International Journal, vol. 13 no. 5 (2023), pp. 640-662.
