How Do Newly Promoted Clubs Survive In The EPL? Part One: What Do The Numbers Say?

The English Premier League (EPL) started its 34th season last weekend with most of the pundits focusing on the top of the table and whether Arne Slot’s Liverpool can retain the title in the face of a rejuvenated challenge by Pep Guardiola’s Manchester City. Relatively little attention has been given to the chances of the newly promoted clubs – Leeds United, Burnley and Sunderland – avoiding relegation with most pundits tipping all three to follow their predecessors in the last two seasons in being immediately relegated back to the Championship. The opening weekend of the EPL season went somewhat against the doom merchants with two of the three newly promoted clubs, Sunderland and Leeds United, winning. This is the first time that two newly promoted clubs have won their first game since Brentford and Watford in 2021/22 with the only other instance of this rare feat being Bolton Wanderers and Crystal Palace in 1997/98 although it should be noted that only Brentford then went on to avoid relegation. I must of course in the interests of objectivity declare my allegiances – I have lived and worked in Leeds for over 40 years and, as a Scot growing up in the 1960s, my “English” team was always Leeds United, then packed with Scottish internationals with Billy Bremner and Eddie Gray my particular favourites. So with Leeds United returning to the EPL after two seasons in the Championship, what are the chances that Leeds United and the other two promoted clubs can defy conventional wisdom and avoid relegation? What do the numbers say?

The Dataset

The dataset used in the analysis covers 30 years of the EPL from season 1995/96 to season 2025/26. The analysis has begun in 1995/96 which was the first season that the EPL adopted its current structure of 20 clubs with three clubs relegated. Note that there were only two teams promoted from the Championship in 1995/96. League performance has been measured by Wins, Draws, Losses, Goals For, Goals Against and League Points. In order to focus on sporting performance, League Points are calculated solely on the basis of games won and drawn, and exclude any points deductions for regulatory breaches. There is no case of any club being relegated solely because of regulatory breaches. Survival Rate is defined as the percentage of newly promoted clubs that were not relegated in their first season in the EPL. Relative Wages has been calculated as the total wage expenditure of clubs as reported in their company accounts relative to the median wage expenditure of all EPL clubs that season (indexed such that 100 = median wage expenditure). This allows comparisons to be drawn across seasons despite the underlying upward trend in wage expenditure. Company accounts are not yet available for 2024/25 so there is no analysis of wage expenditure and sporting efficiency in the most recent EPL season. Total wage expenditure includes all wage expenditure not just player wages. Estimates of individual player wages and total squad costs are available but their accuracy is unknown and limited to recent seasons only. A comparison of one such set of estimated squad wage costs and the wage expenditures reported in company accounts for the period 2014 – 2024 yielded a correlation coefficient of 0.933 which suggests that the “official” wage expenditures provide a very good proxy for player wage costs. Sporting Efficiency is defined as League Points divided by Relative Wages (and multiplied by 100). Sporting Efficiency is a standardised measured of league points per unit of wage expenditure across seasons that attempts to capture the ability of clubs to transform financial expenditure into sporting performance which, when all is said and done, is the fundamental transformation in professional team sports and at the heart of the Moneyball story as to how teams can attempt to offset limited financial resources by greater sporting efficiency.

League Performance of Newly Promoted Clubs

Table 1 summarises the average league performance of newly promoted clubs over the last 30 seasons of the EPL, broken down into 5-year sub-periods in order to detect any long-term trends over time. In addition, the proposition that the average league performance has deteriorated in the last five seasons compared to the previous 25 seasons has been formally tested statistically using a t-test with instances of strong evidence (i.e. statistical significance) of this deterioration indicated by asterisks (or a question mark when is marginally weaker). The key points to emerge are:

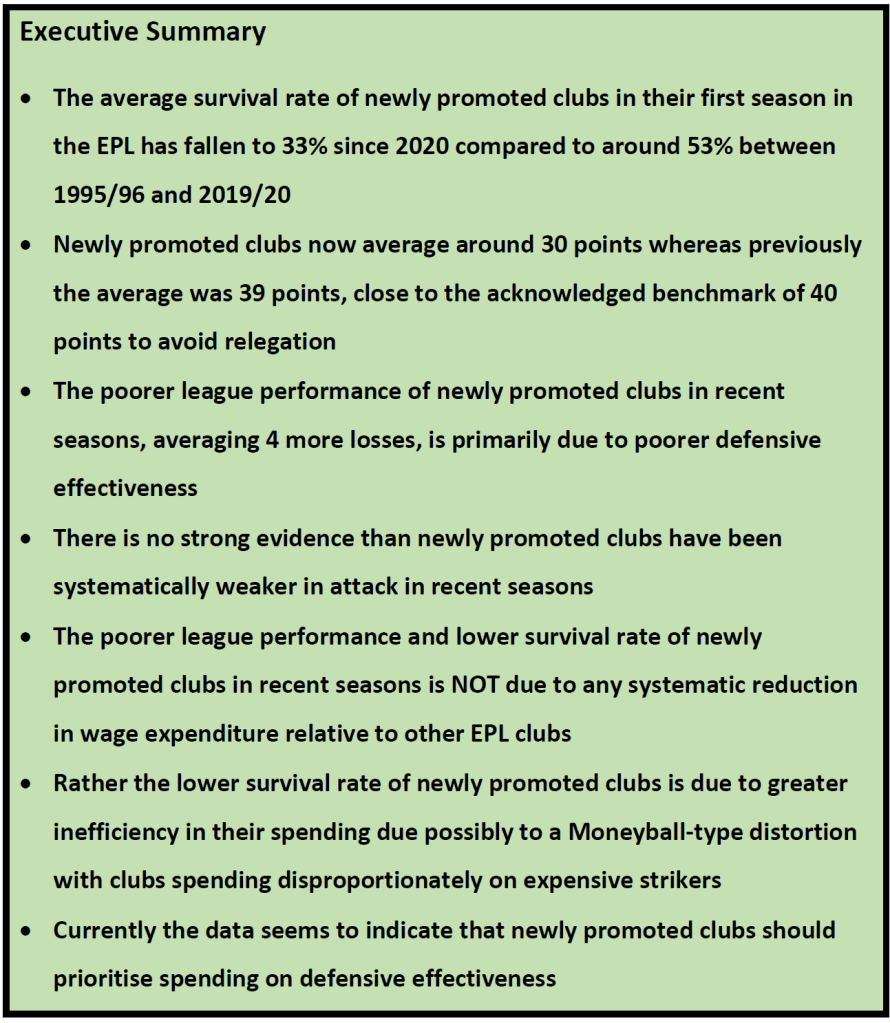
  1. There is no clear trend in wins, draws and losses by newly promoted clubs between 1995/96 and 2019/20 but thereafter there is strong evidence that newly promoted clubs are winning and drawing fewer games and, by implication, losing more games.
  2. Newly promoted clubs averaged 4 more losses since 2020 compared to previous seasons with an average of 22.5 losses in the last five seasons as opposed to an average of 18.7 losses in previous 25 seasons.
  3. The poorer league performance in recent seasons represents a reduction in average league points from 39.0 (1995/96 – 2019/20) to 30.5 points (2020/21 – 2024/25).
  4. Given that the acknowledged benchmark to avoid relegation is 40 points, not surprisingly the survival rate of newly promoted clubs has declined in the last five seasons to only a one-in-three chance of survival (33.3%) compared to a slightly better than one-in-two chance (56.8%) in the previous 25 seasons.
  5. The data suggests strongly that the primary reason for the decline in league performance and survival rates of newly promoted clubs in the last five seasons has been weaker defensive play, not weaker attacking play. Newly promoted clubs averaged 61.1 goals against in seasons 1995/96 – 2019/20 but this rose to 73.8 goals against in the last five seasons which represents very strong evidence of a systematic change in the defensive effectiveness of newly promoted clubs. In stark contrast, the change in goals for has been negligible with a decline from 40.5 (1995/96 – 2019/20) to 38.8 (2020/21 – 2024/25) which is more likely to be accounted for by season-to-season fluctuation rather than any underlying systematic decline in attacking effectiveness.

Wage Costs and Sporting Efficiency of Newly Promoted Clubs

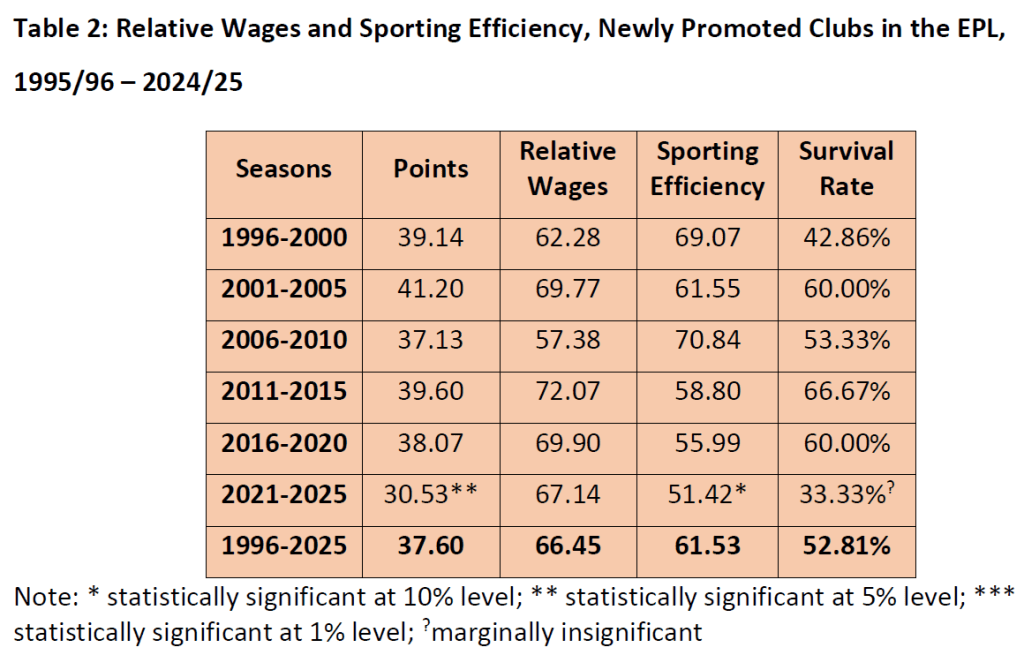
It has been frequently argued that the recent decline in the league performance and survival rates of newly promoted clubs is due to an increasing gap in financial resources between established EPL clubs and the newly promoted clubs. Table 2 addresses this issue. There is absolutely no support for newly promoted clubs being more financially disadvantaged relatively compared to their predecessors. There has been virtually no change in the relative wage expenditure of newly promoted clubs in the last five seasons which has averaged 67.1 compared to 66.3 in the previous 25 seasons. The lower survival rate in recent seasons is NOT due to newly promoted clubs spending proportionately less on playing talent.

There is a very simply equation that holds by definition:

League Performance = Relative Wages X Sporting Efficiency

Since their league performance has declined but the relative wage expenditure of newly promoted clubs has stayed more or less constant, then their sporting efficiency MUST have declined. Table 2 suggests that there may have been a downward trend in the sporting efficiency in newly promoted clubs in the last 15 seasons. In addition, there is strong evidence that there has been a systematic downward shift in the sporting efficiency in the last five seasons to 51.4 compared to the previous average of 63.2 (1995/96 – 2019/20). On its own, this is merely a statement of the obvious dressed up in mathematical and statistical formalism. Newly promoted clubs are performing worse on the pitch as a result of spending less effectively. The crucial question is why league performance and sporting efficiency have declined. The answer may lie in reflecting on the fact that, as we discovered in Table 1, the reason for the poorer league performance is primarily due to poorer defensive effectiveness not poorer attacking effectiveness. Newly promoted clubs seem to be buying the same number of goals scored with the same relative wage budget as in previous seasons but at the cost of buying less defensive effectiveness and conceding more goals. This is consistent with a Moneyball-type distortion in the EPL player market with a premium paid for strikers that may not be fully warranted by current tactical developments in the game. The numbers would support newly promoted clubs giving a higher priority to defensive effectiveness in their recruitment and retention policy and avoiding spending excessively on expensive strikers, particularly those with little experience of playing and scoring in the top leagues.

The IPL Player Auction

Executive Summary

  • There were three key features of the IPL auction values of players in 2023:
  1. A premium was paid for top Indian talent
  2. High values were attached to top but more risky overseas talent
  3. It cost more to buy runs scored than it did to limit runs conceded
  • Mumbai Indians were the top batting side in 2023 but ranked poorly on bowling hence the expectation that they will focus on strengthening their bowling resources in the 2024 auction
  • This intention has clearly been signalled by the release of a large number of their bowlers and the high-profile trade for the return of Hardik Pandya
  • In any auction there is an ever-present danger of the Winner’s Curse – winning the auction by bidding an inflated market value well in excess of the productive value 

During my recent visit to the Jio Institute in Mumbai, I undertook some research on the player auction in the Indian Premier League (IPL). I also used the IPL as the context to investigate the topics of player ratings and player valuation with my graduate sport management class. The discussion with my students, several of whom had a very good knowledge of the IPL and individual teams and players, was motivated by Billy Beane’s involvement in the IPL as an advisor to the Rajasthan Royals. In a recent conversation with Billy, he commented that cricket is undergoing its own sabermetrics revolution. So the question I set the students – are there any apparent Moneyball-type inefficiencies in the valuation of players in the IPL player auctions, with a specific focus on last year’s auction? And looking ahead, could we predict the strategies that individual teams might adopt in the 2024 auction to be held in Dubai on 19th December?

Looking at the 2023 IPL player auction, there appear to be three key features of the player values:

  1. There is a premium paid for top domestic talent when these players become available
  2. High values are attached to top overseas talent but they are higher risk
  3. It costs more to buy runs scored than it does to limit runs conceded

It is no surprise that top Indian players command the highest values – they are experienced and effective in the playing conditions, are big box-office draws, and have high scarcity value. These players are the first on their current team’s retained list and both difficult and expensive to prise them away to another team with a sufficiently lucrative deal for all parties.

As a consequence, teams are forced to focus on the overseas market to find an alternative source for top talent. But this can be a high-risk strategy. Often these players have little or no previous experience in playing in the IPL or even playing in India. Their availability for the whole tournament can be problematic. For example, the IPL overlaps the early part of the English domestic season and top English players are likely to have commitments to the national teams in both test and limited-overs matches. And there is the ever-present risk of injury as the playing schedule extends throughout the whole year. Two of the top valued players in last year’s IPL player auction were Ben Stokes and Harry Brook. Stokes was limited to bowling only one over and had two short innings with the bat before injury ended his IPL season; his obvious priority as captain of the England test team and the inspiration behind the Bazball approach was to get fit for the Ashes series. He has just been released by Chennai Super Kings and has undergone knee surgery in the last few days. Stokes will not be available for the IPL in 2024. Understandably, Harry Brook as an emerging star, commanded one of the highest auction values but his performances in his first season in the IPL were disappointing by his high standards. On my rating system, he ranked only 44th out of the 50 batsmen with 11+ innings but was the 5th highest valued player in the auction. Sunrisers Hyderabad have waived their right to retain his services for the IPL in 2024.

In a number of pro team sports, there is tendency for teams to put a higher value on offensive players who score compared to defensive players who prevent scores being conceded. This is a market inefficiency since a score for has the same weighting as a score against in determining the match outcome. The inefficiency is perhaps more explicable in the invasion-territorial team sports such as the various codes of football since it is more difficult in these sports to separate out the impact of individual player contributions. And, after all, scoring is an observable event whereas defence is about preventing scoring events occurring so there is added uncertainty as to whether or not a score would have been conceded had it not been for a particular defensive action by a player. But this inefficiency is much less explicable in striking-and-fielding team sports such as baseball and cricket where the responsibility for scores conceded can be much more clearly be allocated to individual pitchers/bowlers and fielders. So perhaps a Moneyball-type strategy could be adopted by IPL teams who are weaker in their bowling.

Given that I was based in Mumbai and visiting the Jio Institute which has been established by Reliance Industries who also own the Mumbai Indians franchise, the obvious team to analyse were the Mumbai Indians. I hasten to add that I am not privy to any “inside information” and all of my analysis is based on publicly available data. Table 1 below summarises the batting and bowling performances of the 10 IPL team in 2023.

Table 1: Team Summary Performance, Batting and Bowling, IPL 2023

Note: Runs scored and runs conceded are calculated per ball for all matches (i.e. regular season and end-of-season playoffs). The overall batting and bowling rankings include a number of metrics other than just the scoring and conceding rates.

As can be seen in Table 1, the Mumbai Indians topped the charts in batting but performed relatively poorly in bowling. This suggests that their focus in the coming auction will be on strengthening their bowling. Their intent has clearly been signalled by the release of a large proportion of their bowlers and the high-profile trade for the return of Hardik Pandya.

One final thought as regards the forthcoming IPL player auction. In any auction there is an ever-present danger of the Winner’s Curse – winning the auction by bidding an inflated market value well in excess of the productive value. “Winning the battle, losing the war.” Any bidder in any auction is well advised to have a clear idea of the expected productive value of the future performance of the asset for which they are bidding. In the case of players, it is vital to have a well-grounded estimate of the future value of both the player’s expected incremental contribution on-the-field as well as their image value off-the-field. This should set the upper bound for a team’s bid for their services. As in any acquisition, you are buying the future not the past. Outbid the other teams and you secure the employment contract for the player giving you the rights to the uncertain future performance of the player. Past performance is a guide to possible future performance but you must always factor in the uncertainty inevitably attached to expected future performance.

Moneyball: Twenty Years On – Part Three

Executive Summary

  • Moneyball is principally a baseball story of using data analytics to support player recruitment
  • But the message is much more general on how to use data analytics as an evidence-based approach to managing sporting performance as part of a David strategy to compete effectively against teams with much greater economic power
  • The last twenty years have seen the generalisation of Moneyball both in its transferability to other team sports and its applicability beyond player recruitment to all other aspects of the coaching function particularly tactical analysis
  • There are two key requirements for the effective use of data analytics to manage sporting performance: (1) there must be buy-in to the usefulness of data analytics at all levels; and (2) the analyst must be able to understand the coaching problem from the perspective of the coaches, translate that into an analytical problem, and then translate the results of the data analysis into actionable insights for the coaches

Moneyball is principally a baseball story of using data analytics to support player recruitment. But the message is much more general on how to use data analytics as an evidence-based approach to managing sporting performance as part of a David strategy to compete effectively against teams with much greater economic power. My interest has been in generalising Moneyball both in its transferability to other team sports and its applicability beyond player recruitment to all other aspects of the coaching function particularly tactical analysis.

              The most obvious transferability of Moneyball is to other striking-and-fielding sports, particularly cricket. And indeed cricket is experiencing an analytics revolution akin to that in baseball stimulated in part by the explosive growth of the T20 format in the last 20 years especially the formation of the Indian Premier League (IPL). Intriguingly, Billy Beane himself is now involved with the Rajasthan Royals in the IPL. Cricket analytics is an area in which I am now taking an active interest and on which I intend to post regularly in the coming months after my visit to the Jio Institute in Mumbai.

              My primary interest in the transferability and applicability of Moneyball has been with what I call the “invasion-territorial” team sports that in one way or another seek to emulate the battlefield where the aim is to invade enemy territory to score by crossing a defended line or getting the ball into a defended net. The various codes of football – soccer, rugby, gridiron and Aussie Rules – as well as basketball and hockey are all invasion-territorial team sports. (Note: hereafter I will use “football” to refer to “soccer” and add the appropriate additional descriptor when discussing other codes of football.) Unlike the striking-and-fielding sports where the essence of the sport is the one-on-one contest between the batter and pitcher/bowler, the invasion-territorial team sports involve the tactical coordination of players undertaking a multitude of different skills. So whereas the initial sabermetric revolution at its core was the search for better batting and pitching metrics, in the invasion-territorial team sports the starting point is to develop an appropriate analytical model to capture the complex structure of the tactical contest involving multiple players and multiple skills. The focus is on multivariate player and team performance rating systems. And that requires detailed data on on-the-field performance in these sports that only became available from the late 1990s onwards.

              When I started to model the transfer values of football players in the mid-90s, the only generally available performance metrics were appearances, scoring and disciplinary records. These worked pretty well in capturing the performance drivers of player valuations and the statistical models achieved goodness of fit of around 80%. I was only able to start developing a player and team performance rating system for football in the early 2000s after Opta published yearbooks covering the English Premier League (EPL) with season totals for over 30 metrics for every player who had appeared in the EPL in the four seasons, 1998/99 – 2001/02. It was this work that I was presenting at the University of Michigan in September 2003 when I first read Moneyball.

              My player valuation work had got me into the boardrooms and I had used the same basic approach to develop a wage benchmarking system for the Scottish Premier League. But getting into the inner sanctum of the football operation in clubs proved much more difficult. My first success was to be invited to an away day for the coaching and support staff at Bolton Wanderers in October 2004 where I gave a presentation on the implications of Moneyball for football. Bolton under their head coach Sam Allardyce had developed their own David strategy – a holistic approach to player management based on extensive use of sport science. I proposed an e-screening system of players as a first stage of the scouting process to allow a more targeted approach to the allocation of Bolton’s scarce scouting resources. Pleasingly, Bolton’s Performance Director thought it was a great concept; disappointingly he wanted it to be done internally. It was a story repeated several times with both EPL teams and sport data providers – interest in the ideas but no real engagement. I was asked to provide tactical analysis for one club on the reasons behind the decline in their away performances but I wasn’t invited to present and participate in the discussion of my findings. I was emailed later that my report had generated a useful discussion but I needed more specific feedback to be able to develop the work. It was a similar story with another EPL club interested in developing their player rating system. Again the intermediaries presented my findings and the feedback was positive on the concept but then set out the limitations which I had listed in my report, all related to the need to use more detailed data than that with which I had been provided. Analytics can only be effective when there is meaningful engagement between the analyst and the decision-maker.

              The breakthrough in football came from a totally unexpected source – Billy Beane himself. Billy had developed a passion for football (soccer) and the Oakland A’s ownership group had acquired the Earthquakes franchise in Major League Soccer (MLS). Billy had found out about my work in football via an Australian professor at Stanford, George Foster, a passionate follower of sport particularly rugby league. Billy invited me to visit Oakland and we struck up a friendship that lasts to this day. As an owner of a MLS franchise, Oakland had access to performance data on every MLS game and, to cut a long story short, Billy wanted to see if the Moneyball concept could be transferred to football. Over the period 2007-10 I produced over 80 reports analysing player and team performance, investigating the critical success factors (CSFs) for football, and developing a Value-for-Money metric to identify undervalued players. We established proof of concept but at that point the MLS was too small financially to offer sufficient returns to sustain the investment needed to develop analytics in a team. I turned again to the EPL but with the same lack of interest as I had encountered earlier. The interest in my work now came from outside football entirely – rugby league and rugby union.

               The first coach to take my work seriously enough to actually engage with me directly was Brian Smith, an Australian rugby league coach. I spent the summer of 2005 in Sydney as a visiting academic at UTS. I ran a one-day workshop for head coaches and CEOs from a number of leading teams mainly in rugby league and Aussie Rules football. One of the topics covered was Moneyball. Brian Smith was head coach of Paramatta Eels and had developed his own system for tracking player performance. Not surprisingly, he was also a Moneyball fan. Brian gave me access to his data and we had a very full debrief on the results when Brian and his coaching staff visited Leeds later that year. It was again rugby league that showed real interest in my work after I finished my collaboration with Billy Beane. I met with Phil Clarke and his brother, Andrew, who ran a sport data management company, The Sports Office. Phil was a retired international rugby league player who had played most of his career with his hometown team, Wigan. As well as The Sports Office, Phil’s other major involvement was with Sky Sports as one of the main presenters of their rugby league coverage. I worked with Phil in analysing a dataset he had compiled on every try scored in Super League in the 2009 season and we presented these results to an industry audience. Subsequently, I worked with Phil in developing the statistical analysis to support the Sky Sports coverage of rugby league including an in-game performance gauge that included a traffic-lights system for three KPIs – metres gained, line breaks and tackle success – as well as predicting what the points margin should be based on the KPIs.

              But Phil’s most important contribution to my development of analytics with teams was the introduction in March 2010 to Brendan Venter at Saracens in rugby union. Brendan was a retired South African international who had appeared as a replacement in the famous Mandela World Cup Final in 1995. He had taken over as the Director of Rugby at Saracens at the start of the 2009/10 season and instituted a far-reaching cultural change at the club, central to which was a more holistic approach to player welfare and a thorough-going evidence-based approach to coaching. Each of the coaches had developed a systematic performance review process for their own areas of responsibility and the metrics generated had become a key component of the match review process with the players. My initial role was to develop the review process so that team and player performance could be benchmarked against previous performances. A full set of KPIs were identified with a traffic-lights system to indicate excellent, satisfactory and poor performance levels.  This augmented match review process was introduced at the start of the 2010/11 season and coincided with Saracens winning the league title for the first time in their history. The following season I was asked by the coaches to extend the analytics approach to opposition analysis, and the sophistication of the systems continued to evolve over the five seasons that I spent at Saracens.

              I finished at Saracens at the end of the 2014/15 season although I have continued to collaborate with Brendan Venter on various projects in rugby union over the years. But just as my time with Saracens was ending, a new opportunity opened up to move back to football, again courtesy of Billy Beane. Billy had been contacted by Robert Eenhoorn, a former MLB player from the Netherlands, who is now the CEO of AZ Alkmaar in the Dutch Eredivisie. Billy had become an advisor to AZ Alkmaar and had suggested to Robert to get me involved in the development of AZ’s use of data analytics. AZ Alkmaar are a relatively small-town team that seek to compete with the Big Three in Dutch football (Ajax Amsterdam, PSV Eindhoven and Feyenoord) in a sustainable, financially prudent way. Like Billy, Robert understands sport as a contest and sport as a business. AZ has a history of being innovative, particularly in youth development with a high proportion of their first-team squad coming from their academy. I developed similar systems as I had at Saracens to support the first team with performance reviews and opposition analysis. It was a very successful collaboration which ended in the summer of 2019 with data analytics well integrated into AZ’s way of doing things.

              Twenty years on, the impact of Moneyball has been truly revolutionary. Data analytics is now an accepted part of the coaching function in most elite team sports. But teams vary in the effectiveness with which they employ data analytics particularly in how well it is integrated into the scouting and coaching functions. There are still misperceptions about Moneyball especially in regard the extent to which data analytics is seen as a substitute for traditional scouting methods rather than being complementary. Ultimately an evidence-based approach is about using all available evidence effectively, not just quantitative data but also qualitative expert evaluations of coaches and scouts. Data analytics is a process of interrogating all of the data.

So what are the lessons from my own experience of the transferability and applicability of Moneyball? I think that there are two key lessons. First, it is crucial that there is buy-in to the usefulness of data analytics at all levels. It is not just leadership buy-in. Yes, the head coach and performance director must promote an evidence-based culture but the coaches must also buy-in to the analytics approach for any meaningful impact on the way things actually get done. And, of course, players must buy-in to the credibility of the analysis if it is to influence their behaviour. Second, the analyst must be able to understand the coaching problem from the perspective of the coaches, translate that into an analytical problem, and then translate the results of the data analysis into actionable insights for the coaches. There will be little buy-in from the coaches if the analyst does not speak their language and does not respect their expertise and experience.

Read Other Related Posts

Moneyball: Twenty Years On – Part Two

Executive Summary

  • Financial determinism in pro team sports is the basic proposition that the financial power to acquire top playing talent determines sporting performance (sport’s “ law of gravity”)
  • The Oakland A’s under Billy Beane have consistently defied the law of gravity for over a quarter of a century by using a “David strategy” of continuous innovation based on data analytics and creativity

Financial determinism in pro team sports is the basic proposition that sporting performance is largely determined by the financial power of a team to acquire top playing talent. This gives rise to sport’s equivalent of the law of gravity – teams will tend to perform on the field in line with their expenditure on playing talent relative to other teams in the league. The biggest spenders will tend to finish towards the top of the league; the lowest spenders will tend to finish towards the bottom of the league. A team may occasionally defy the law of gravity – Leicester City winning the English Premier League in 2016 is the most famous recent example – but such extreme cases of beating the odds are rare.

Governing bodies tend to be very concerned about financial determinism since it can undermine the uncertainty of outcome – sport, after all, is unscripted drama where no one knows the outcome in advance. It is a fundamental tenet of sports economics that uncertainty of outcome is a necessary requirement for spectator interest and the financial stability of pro sports leagues. Hence why governing bodies have actively intervened over the years to try to maintain competitive balance with revenue-sharing arrangements (e.g. shared gate receipts and collective selling of media rights) and player labour market regulations (e.g. salary caps and player drafts). And financial determinism creates the danger that teams without rich owners will incur unsustainable levels of debt in pursuit of the dream of sporting success and eventually collapse into bankruptcy (as Leeds United fans know only too well given their experience in the early 2000s).

Major League Baseball (MLB), like the other North American Major Leagues, have actively intervened in the player labour market via salary caps, luxury taxes on excessive spending and a player draft system to try to reduce the disparity between teams in the distribution of playing talent. But financial determinism is still strong in the MLB as can be seen in Figure 1 which shows the average win rank and average wage rank of the 30 MLB team over the 26-year period, 1998 – 2023 (1998 was Billy Beane’s first season as GM at the Oakland A’s). There is a very strong correlation between player wage expenditure and regular-season win percentage (r = 0.691). The three biggest spenders – New York Yankees, Boston Red Sox and LA Dodgers – have been amongst the five most successful teams over the period with the New York Yankees topping both charts (with an average win rank of 5.8 and an average wage rank 1.8).

Figure 1: Financial Determinism in the MLB, 1998 – 2023    

The standout team in defying the law of gravity are Oakland A’s. Over a 26-year period, their average wage rank has been 25.5 but their average win rank has been 13.0 which gives a rank gap of 12.5. Put another way, the A’s have had the 3rd lowest average wage rank over the last 26 years but are in the top ten in terms of their average win rank. Looking at Figure 1, the obvious benchmarks for the A’s in spending terms are Tampa Bay Rays, Miami Marlins and Pittsburgh Pirates but all of these teams have had much poorer sporting performance than the A’s. Indeed in terms of sporting performance as measured by average win rank, the A’s peers are LA Angels, their Bay Area rivals, San Francisco Giants, Houston Astros and Cleveland Guardians (formerly Cleveland Indians) but all of these teams have had much higher levels of expenditure on player salaries.

Figure 2 details the year-to-year record of the A’s over the whole period of Billy Bean’s tenure as GM then Executive Vice President for Baseball Operations. As can be seen, the A’s have consistently been amongst the lowest spenders in the MLB and, indeed, there are only two years (2004 and 2007) when they were not in the bottom third. The regular-season win percentage has been rather cyclical with peaks in 2001/2002, 2006, 2012/2013 and 2018/2019. The 2001 and 2002 seasons are the “Moneyball Years” covered by Michel Lewis in the book when the A’s had the 2nd best win percentage in both seasons. As discussed in Part One of this post, the efficient market hypothesis (EMH) in economics suggests that any competitive advantage based on inefficient use of information by other traders will quickly evaporate when the informational inefficiencies become widely recognised. Hence, the EMH implies that the A’s initial success would be short-lived and other teams would soon “catch up” and start to use similar player metrics as the A’s. Which is exactly what happened. In fact, Moneyball led all other MLB teams to start using data analytics more extensively, some more than others. This is what makes the A’s experience so unique – other teams imitated the A’s in their use of data analytics and developed their own specific data-based strategies but still the A’s kept punching well above their financial weight and making it to the post-season playoffs on several occasions. This suggests that the A’s have been highly innovative in developing analytics-based David strategies which have informed both their international recruitment and player development in their farm system. Just as in the Land of the Red Queen in Alice in Wonderland, so too in elite sport when competing with analytics, you’ve got to keep running to stay still.

Success = Analytics + Creativity.

Figure 2: Oakland A’s Under Billy Beane, 1998 – 2023

Read Other Related Posts

Moneyball: Twenty Years On – Part One

Executive Summary

  • The lasting legacy of Moneyball is as an exemplar of the possibilities of competitive advantage to be gained from the smarter use of data analytics as part of an evidence-based approach to decision-making
  • The technical essence of Moneyball is using on-base percentage (OBP) as the primary hitter metric in baseball for player recruitment
  • Moneyball shows how Billy Beane and the Oakland A’s developed a David strategy to take advantage of the inefficiency of other MLB teams in valuing the win contributions of players.

Unbelievably it is twenty years ago this month since Michael Lewis’s book, Moneyball: The Art of Winning an Unfair Game, was published. (The subtitle is really important as I’ll discuss later.) It is a book, along with the spin-off Hollywood movie starring Brad Pitt, that has had a massive impact on elite team sports around the world and fundamentally changed the way that teams do things. And it has been hugely significant to me, personally. Moneyball quite simply changed my professional life.

              I’ve told the story so many times of how I came to read Moneyball for the first time. I was visiting the University of Michigan at the end of September 2003 to talk about the work I was doing in professional team sport both academically and as a practitioner. I had developed a player valuation system to estimate transfer values of football players. I was being driven to Detroit airport on the Friday afternoon at the end of my visit when the prof who had invited me said “You must read this new book, Moneyball. It’s you but baseball.” I purchased it in the airport at 6pm that evening and, partly due to a delay in my flight to Edmonton to visit a dear friend and fellow academic, the late Dr Trevor Slack, I completed my first read by 6am Saturday morning. I was blown away. I had been advocating a more data-based approach to player valuation and here was someone, Billy Beane, actually doing it at the elite level and creating a winning team on a very limited budget. A real-life case study of what I came to call a “David strategy” – a smart and financially sustainable way of competing against financial giants. Remember those were the days where my local club, Leeds United, were on the brink of bankruptcy thanks to a financial strategy based more on a roll of the dice than rational calculation. Smart thinking wasn’t much in evidence in that particular boardroom.

              It’s no surprise really that Moneyball is a baseball story in the sense that the first analytics-based approach in a team sport was always most likely to occur in a striking-and-fielding sport such as baseball or cricket for one very simple reason – the ease of data collection. At the core of a striking-and-fielding sports is the one-on-one contest between pitcher/bowler and batter, easily recorded by paper-and-pencil methods. Hence, the essential performance data for baseball and cricket have been widely available from the earliest days. As a consequence, you do not need to be an “insider” working at the elite level of these sports to be able to analyse the data.  Any fan with an interest in analysing baseball and cricket data has been able to do so. For example, Stephen Jay Gould, the evolutionary biologist who developed the theory of punctuated equilibrium (and, incidentally, was a visiting undergraduate student at the University of Leeds), devoted a whole section of his book Life’s Grandeur: The Spread of Excellence from Plato to Darwin (Jonathan Cape, London, 1996) to the evolution of performance in baseball, particularly focusing on why no one has posted a batting average over 0.400 in the MLB since Ted Williams in 1941. Of course, the baseball fan par excellence with an interest in analysing the data is Bill James and it was his analysis more than anything that inspired Billy Beane and the Oakland A’s.

              The technical essence of Moneyball is the use of on-base percentage (OBP) as the primary hitter metric for player recruitment. James had shown that OBP is a much better predictor of game outcomes than the two traditional hitting metrics – the batting average and the slugging average – which both only allow for the batter’s ability to hit their way to base and take no account of their propensity to be walked to base. James actually proposed combining OBP and the slugging average i.e. On-base Plus Slugging (OPS) as the preferred hitting metric. Effectively, conventional baseball wisdom treated walks more as a pitcher error or a pitcher risk-averse tactic rather than allowing for the hitter skill of selecting which pitch to swing at and which to leave. It was this perception of walks that opened up the possibility of a “free lunch”. In economic terms, by using hitting average and slugging average to value hitters and ignoring OBP, the baseball players’ labour market was being inefficient. It would be possible to buy runs more cheaply by targeting hitters that had good hitting/slugging averages but with a high propensity to be walked to base. If this latter skill was not valued by the market, it could be bought for free.

              Moneyball soon found its way onto many business school reading lists as a real-world example of the efficient market hypothesis (EMH) which proposed that there is an inherent tendency for markets to eliminate informational inefficiencies where available information is being used incorrectly. As soon as one trader recognises the inefficiency, they will exploit it by buying under-priced assets and making a profit. In the case of Billy Beane, he acquired under-valued hitters that meant that Oakland could punch way above their financial weight, buying more runs from their limited budget by being smarter than other teams in valuing the win contributions of players. And, in retrospect, it is no surprise that it was Michael Lewis who wrote Moneyball since he started his professional life as a financial trader, well aware of how to use information to profit in markets. No wonder the story of Billy Beane and the Oakland A’s appealed to him. It is a story of enduring appeal not only for baseball but all team sports and, indeed, for any organisation trying to find a David strategy to gain a competitive advantage by being smarter in their use of data. I will discuss this enduring appeal further in Part 2 next week.

Read Other Related Posts