Executive Summary
- Divergent revenue growth paths in the Big Five European football leagues since 1996 has more than doubled the inequality in the financial strength of these leagues.
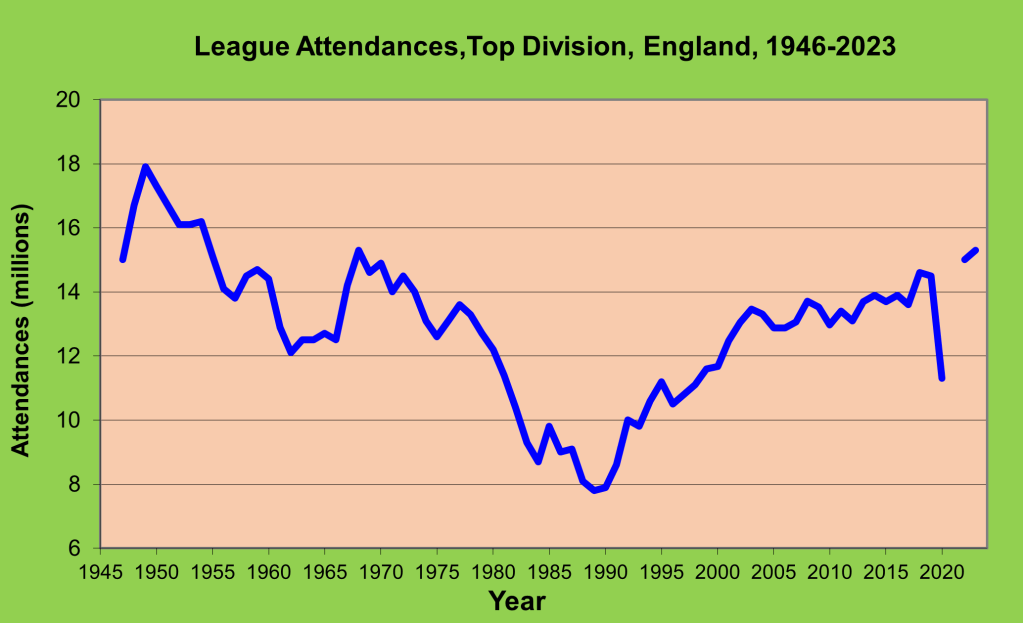
- The financial dominance of the EPL is based on growing gate attendances, increasing value of media rights and high marketing efficiency.
- The financial dominance of the EPL puts it at a massive advantage in attracting the best sporting talent.
- The pandemic highlighted the precarious financial position of the French and Italian leagues due to high wage-revenue ratios and consequent operating losses
- The financial regulation of the Bundesliga clubs put them in a much stronger position to cope with loss of revenues during the pandemic.
The top tiers of the domestic football leagues in England, France, Germany, Italy and Spain constitute the so-called “Big Five” of European football in financial terms as measured by the total revenues of their member clubs. Figure 1 shows the growth in revenues in the Big Five since 1996. The most striking feature of this timeplot is the divergent growth paths of the Big Five. From a starting point of relative parity in 1996 the divergent growth paths of the Big Five call into question whether it is even appropriate to still talk in terms of the Big Five. Using the coefficient of variation (CoV) as a measure of relative dispersion (effectively CoV is just a standardised standard deviation with the scale effect removed), the degree of dispersion between the revenues of the Big Five has more than doubled from 0.244 in 1996 to 0.509 in 2022. The English Premier League (EPL) is quite literally in a league of its own in financial terms with total revenues of €6.4bn in 2022. The rest of the Big Five lag a long way behind with the Spanish La Liga and German Bundesliga grossing revenues of €3.3bn and €3.1bn, respectively in 2022 and the Italian Serie A and French Ligue 1 lagging another €1bn or so behind with revenues of €2.4bn and €2.0bn, respectively. And with the expected uplift in the EPL’s next media rights deal and the continued growth in gate attendances, the gap between the EPL and the rest of the Big Five looks set to increase further.
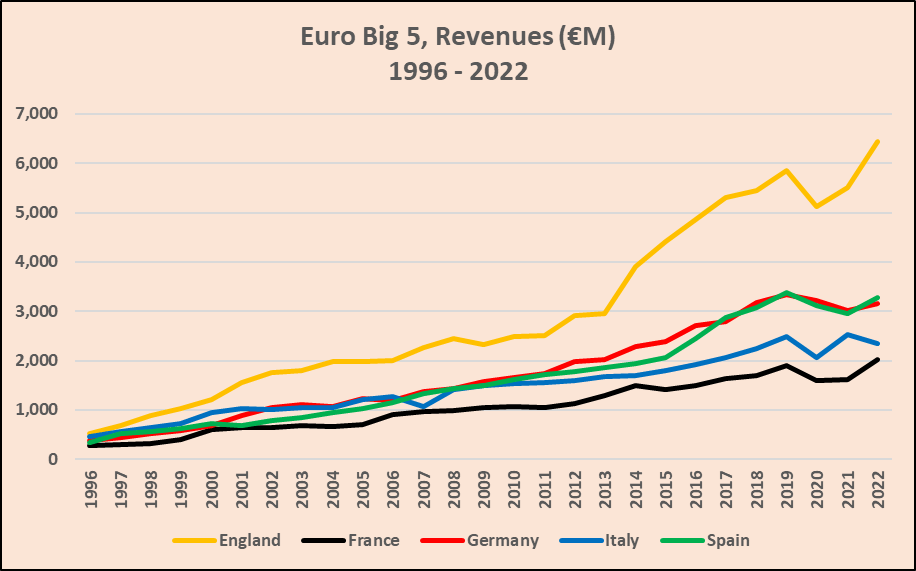
Figure 1: Revenues (€m), European Big Five, 1996 – 2022
Another key feature of Figure 1 is the impact of the Covid pandemic on league revenues. The biggest losers in 2020 were the EPL clubs with the postponement of the last part of the 2019/20 leading to an overall loss of revenue of around €0.7bn. But although the whole of the 2020/21 season was played behind closed doors wiping out matchday revenues, media revenues increased with all games shown live. By 2022 with the return of spectators to football grounds and continued growth in media revenues, the EPL was back on its pre-pandemic trend with revenues over 10% higher than in 2019 prior to the pandemic. In contrast, of the other Big Five, only the French Ligue 1 had increased revenues in 2022 above the pre-pandemic level.
In assessing the revenue performance of football leagues/clubs, apart from revenue growth rates, there are two very useful revenue KPIs (Key Performance Indicators):
Media% = media revenues as a % of total revenues; and
Local Spend = non-media revenues per capita (using average league gate attendances as the size measure to standardise club/league revenues)
Media% shows the dependency of the league and its clubs on the value of their media rights. Local Spend is a measure of the marketing efficiency of clubs in generating matchday and commercial revenues relative to the size of their active fanbase as measured by average league gate attendance. As can be seen in Table 1 which reports these two revenue KPIs for 2019, 2021 and 2022, all the Big Five became much more dependent on media revenues during the Covid years as seen in the increased Media% in 2021. As would be expected Local Spend fell sharply in the Covid years with the loss of matchday revenues. What is more concerning in the longer term for the rest of the Big Five is that the financial strength of the EPL is based not only on the much higher value of their media rights but also the stronger capability of EPL clubs to generate matchday revenues and commercial revenues. Prior to the pandemic only the Spanish La Liga got close to the EPL in terms of Local Spend but by 2022 the EPL had a substantial lead over all of the other Big Five in Local Spend. Given as noted earlier, the underlying upward trends in gate attendances and the value of media rights in the EPL, when you also allow for the marketing efficiency advantage as measured by Local Spend, the financial dominance of the EPL seems likely to grow unabated in the coming years.
Table 1: Revenue KPIs, European Big Five, Selected Years
| League | Media% | Local Spend (€) | ||||
| 2019 | 2021 | 2022 | 2019 | 2021 | 2022 | |
| England | 59.12% | 68.66% | 54.14% | 3,131 | 2,189 | 3,732 |
| France | 47.37% | 51.80% | 35.98% | 2,192 | 1,727 | 2,879 |
| Germany | 44.33% | 55.21% | 43.82% | 2,143 | 1,646 | 2,164 |
| Italy | 58.52% | 69.92% | 56.94% | 2,049 | 1,383 | 1,842 |
| Spain | 54.25% | 67.74% | 58.53% | 2,871 | 1,647 | 2,354 |
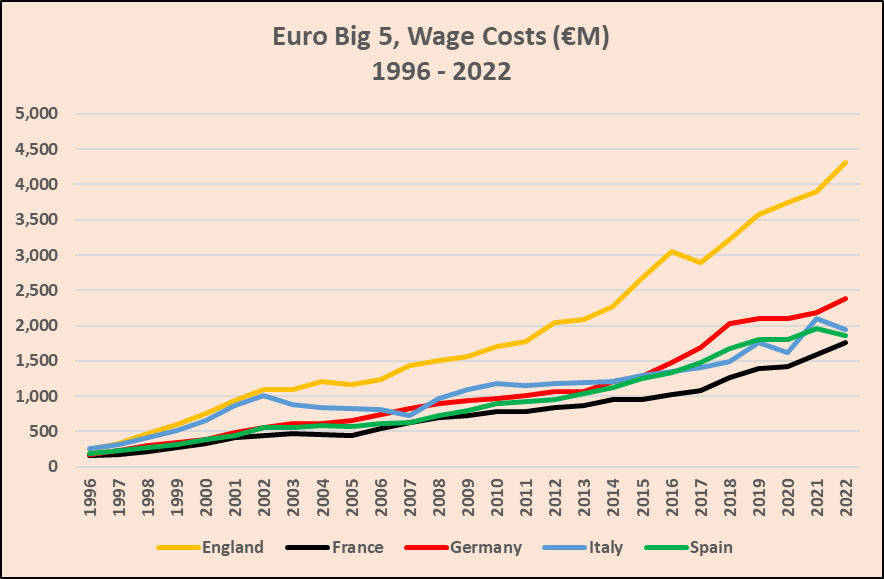
The financial strength of the EPL allows their clubs to offer lucrative salaries and pay high transfer fees to attract the best players in the global football players’ labour market. As can be seen in Figure 2, the divergent revenue growth paths of the Big Five in Figure 1 are replicated in similar divergent wage growth paths. Effectively, the €3bn revenue advantage of the EPL in 2022 allowed EPL clubs to spend €2bn more on wage costs than the German Bundesliga, the next biggest spenders in the Big Five. And it is not just the best players that can be attracted to the EPL, it is also the best coaching and support staff. The danger of financial dominance in pro team sports is that it can lead to sporting dominance and this, in turn, can undermine the sustainability of the league as teams with less financial power seek to remain competitive by overspending on wages, leading to operating losses and increasing levels of debt.
Figure 2: Wage Costs (€m), European Big Five, 1996 – 2022
The danger of overspending on wage costs relative to revenues can be seen very clearly in the wage-revenue ratio, possibly the most important financial performance ratio in pro team sports. By far the most dominant cost in any people business such as sport and entertainment is wages. If wage costs are too high relative to revenues, teams will make operating losses and will require to be either deficit-financed by their owners or debt-financed with all of the attendant risks. As can be seen in Figure 3, the wage-revenue ratios have tended to be highest in the French and Italian leagues, the smallest financially of the Big Five leagues. Indeed in the early 2000s the Italian Serie A got close to spending all of its revenue on wages, with the French Ligue 1 nearly emulating this during the Covid years.
Figure 3: Wage-Revenue Ratios, European Big Five, 1996 – 2022

Table 2 shows the danger of the financially smaller leagues having higher wage-revenue ratios. They can be put in a very precarious position if there is a sudden loss of revenues as happened during the pandemic (but could also happen if there is a loss in the value of a league’s media rights). Wage costs are largely fixed at any point in time through contractual commitments so any reduction in revenues is likely to lead to higher wage-revenue ratios and operating losses. As a benchmark, financial prudence would normally dictate wage-revenue under 65% in order to make operating profits. The French and Italian leagues operated with wage-revenue ratios above 70% prior to the pandemic and both remained above 80% in 2022. The Spanish La Liga was on a par with the EPL in 2019 at just over 60%. Both leagues saw their wage-revenue ratio rise above 70% in 2021 but, whereas the EPL fell back below 67% in 2022, La Liga remained high above 70%.
Table 2: Wage-Revenue Ratio, European Big Five, Selected Years
| League | Wage-Revenue Ratio | ||
| 2019 | 2021 | 2022 | |
| England | 61.17% | 71.05% | 66.84% |
| France | 73.03% | 98.27% | 86.87% |
| Germany | 53.75% | 64.96% | 59.13% |
| Italy | 70.42% | 82.98% | 82.98% |
| Spain | 62.04% | 74.19% | 72.66% |
In footballing terms, the bastion of football prudence has been the German Bundesliga with its longstanding financial management regime requiring clubs to submit budgets for approval as a condition of their league membership. As seen in both Figure 3 and Table 2, the Bundesliga has historically operated with wage-revenue ratios between 45% and 55%. Even with the loss of revenue during the Covid years, the wage-revenue ratio only hit 65% and fell back below 60% in 2022. The effectiveness of the German approach can be seen in Table 3 which reports the marginal wage-revenue ratio (MWRR) over the last 27 years. What this ratio shows is the proportion on average spent on wages of every increment of €1m of revenue over the last 27 years as each league has grown financially. The EPL has had a MWRR of 65.0% with the Spanish La Liga operating in a very similar way with a MWRR of 67.7%. The Bundesliga has had a MWRR of 56.5%. Given that the Spanish and German leagues are of a similar size in revenue terms, it suggests that long term the Germen financial management regime has lowered their wage-revenue ratio by 11% compared to what it would have been with a lighter touch. The very high MWRRs of the French and Italian leagues coupled with their lower revenue growth rates further reinforce the concerns over their financial future.
Table 3: Marginal Wage-Revenue Ratio, European Big Five, 1996 – 2022
| League | Marginal Wage-Revenue Ratio 1996 – 2022 |
| England | 65.03% |
| France | 83.21% |
| Germany | 56.60% |
| Italy | 79.31% |
| Spain | 67.73% |
Notes:
- The raw financial data for the analysis has been sourced from various editions of Deloitte’s Annual Review of Football Finance (Annual Review of Football Finance 2023 | Deloitte Global)
- Throughout the years refer to financial year-end. Hence, for example, the figures reported for 1996 refer to season 1995/96.
- The base year of 1996 has been used since 1995/96 was the first season when the EPL adopted its current 20-club, 380-game format.
- Average league gates for season 2019/20 have been used to calculate Local Spend during the Covid years when games were played behind closed doors with no spectators in the stadia.