Measuring Trend Growth

Executive Summary

  • The most useful summary statistic for a trended variable is the average growth rate
  • But there are several different methods for calculating average growth rates that can often generate very different results depending on whether all the data is used or just the start and end points, and whether simple or compound growth is assumed
  • Be careful of calculating average growth rates using only the start and end points of trended variables since this implicitly assumes that these two points are representative of the dynamic path of the trended variable and may give a very biased estimate of the underlying growth rate
  • Best practice is to use all of the available data to estimate a loglinear trendline which allows for compound growth and avoids having to calculate an appropriate midpoint of a linear trendline to convert the estimated slope into  growth rate

When providing summary statistics for trended time-series data, the mean makes no sense as a measure of the point of central tendency. By definition, there is no point of central tendency in trended data. Trended data are either increasing or decreasing in which case the most useful summary statistic is the average rate of growth/decline. But how do you calculate the average growth rate? In this post I want to discuss the pros and cons of the different ways of calculating the average growth rate, using total league attendances in English football (the subject of my previous post) as an illustration.

              There are at least five different methods of calculating the average growth rate:

  1. “Averaged” growth rate: use gt = (yt – yt-1)/yt-1 to calculate the growth rate for each period then average these growth rates
  2. Simple growth rate: use the start and end values of the trended variable to calculate the simple growth rate with the trended variable modelled as yt+n = yt(1 + ng)
  3. Compound growth rate: use the start and end values of the trended variable to calculate the compound growth rate with the trended variable modelled as yt+n = yt(1 + g)n
  4. Linear trendline: estimate the line of best fit for yt = a + gt (i.e. simple growth)
  5. Loglinear trendline: estimate the line of best fit for ln yt = a + gt (i.e. compound growth)

where y = the trended variable; g  = growth rate; t = time period; n = number of time periods; a = intercept in line of best fit

These methods differ in two ways. First, they differ as to whether the trend is modelled as simple growth (Methods 2, 4) or compound growth (Methods 3, 5). Method 1 is effectively neutral in this respect. Second, the methods differ in terms of whether they use only the start and end points of the trended variable (Methods 2, 3) or use all of the available data (Methods 1, 4, 5). The problem with only using the start and end points is that there is an implicit assumption that these are representative of the underlying trend with relatively little “noise”. But this is not always the case and there is a real possibility of these methods biasing the average growth rate upwards or downwards as illustrated by the following analysis of the trends in football league attendances in England since the end of the Second World War.

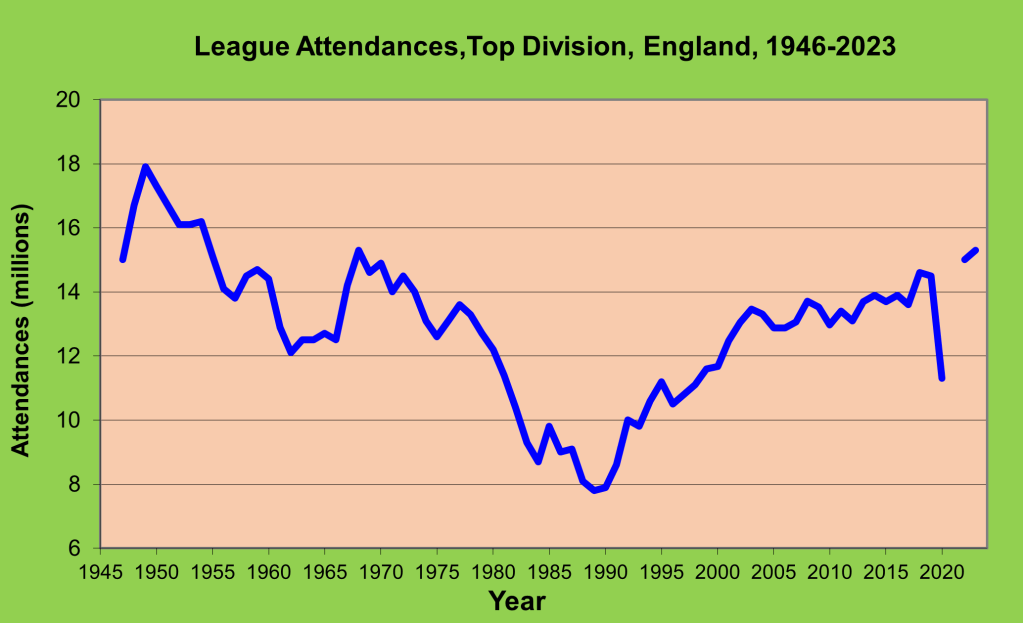
Figure 1: Total League Attendances (Regular Season), England, 1946/47-2022/23

This U-shaped timeplot of total league attendances in England since the end of the Second World War splits into two distinct sub-periods of decline/growth:

  • Postwar decline: 1948/49 – 1985/86
  • Current revival: 1985/86 – 2022/23

Applying the five methods to calculate the average annual growth rate of these two sub-periods yields the following results:

MethodPostwar Decline 1948/49 – 1985/86Current Revival 1985/86 – 2022/23*
Method 1: “averaged” growth rate-2.36%2.28%
Method 2: simple growth rate-1.62%3.00%
Method 3: compound growth-2.45%2.04%
Method 4: linear trendline-1.89%1.75%
Method 5: loglinear trendline-1.95%1.85%
*The Covid-affected seasons 2019/20 and 2020/21 have been excluded from the calculations of the average growth rate.

What the results show very clearly is the wide variability in the estimates of average annual growth rates depending on the method of calculation. The average annual rate of decline in league attendances between 1949 and 1986 varies between -1.62% (Method 2 – simple growth rate) to -2.45% (Method 3 – compound growth rate). Similarly the average annual rate of growth from 1986 onwards ranges from 1.75% (Method 4 – linear trendline) to 3.00% (Method 2 – simple growth rate). To investigate exactly why the two alternative methods for calculating the simple growth rate during the Current Revival give such different results, the linear trendline for 1985/86 – 2022/23 is shown graphically in Figure 2.

Figure 2: Linear Trendline, Total League Attendances, England, 1985/86 – 2022/23

As can be seen, the linear trendline has a high goodness of fit (R2 = 93.1%) and the fitted endpoint is very close to the actual gate attendance of 34.8 million in 2022/23. However, there is a relatively large divergence at the start of the period with the fitted trendline having a value of 18.2 million whereas the actual gate attendance in 1985/86 was 16.5 million. It is this divergence that accounts in part for the very different estimates of average annual growth rate generated by the two methods despite both assuming a simple growth rate model. (The rest of the divergence is due to the use of midpoint to convert the slope of the trendline into a growth rate.)

              So which method should be used? My advice is to be very wary of calculating average growth rates using only the start and end points of trended variables. You are implicitly assuming that these two points are representative of the dynamic path of the trended variable and may give a very biased estimate of the underlying growth rate. My preference is always to use all of the available data to estimate a loglinear trendline which allows for compound growth and avoids having to calculate an appropriate midpoint of a linear trendline to convert the estimated slope into a growth rate.

Read Other Related Posts

League Gate Attendances in English Football: A Historical Perspective

Executive Summary

  • The historical trends in league gate attendances in English football can be powerfully summarised visually using timeplots
  • Total league attendances peaked in 1948/49 and thereafter declined until the mid-1980s
  • League attendances across the Premier League and Football League have recovered dramatically since the mid-1980s and are now at levels last experienced in the 1950s
  • Using average gates to allow for changes in the number of clubs and matches, the  Premiership matches in 2022/23 averaged 40,229 spectators per match, the highest average gate in the top division since the formation of the Football League in 1888 

How popular are the top four tiers of English league football as a spectator sport from a historical perspective? That’s the question that I want to address in this post using timeplots to visualise the historical trends in gate attendances. I have compiled a dataset with total league attendances for every season since the Football League began in 1888. To ensure as much comparability as possible, I have included only regular-season matches and excluded post-season play-off matches. (A historical footnote – post-season playoffs to decide promotion/relegation are not a modern innovation. There were playoffs called “test matches” in the early years of the Football League after the creation of the Second Division in 1892 but these were abandoned in 1898 and replaced by automatic promotion and relegation following  a scandal when Stoke City and Burnley played out a convenient goalless draw that ensured both would be promoted.)

Total league attendances for the top four divisions are plotted in Figure 1 with three breaks: 1915/16 – 1918/19 due to the First World War, 1939/40 – 1945/46 due to the Second World War and 2020/21 due to the Covid pandemic when all matches were played behind closed doors. In addition, total attendances dropped sharply in 2019/20 due to the final part of the season being postponed and the matches eventually played behind closed doors in the case of the Premier League and Championship, and cancelled entirely in League One and League Two.

Figure 1: Total League Attendances (Regular Season), England, 1888-2023

The Football League started in 1888 with a single division of 12 clubs. Preston North End were the original “Invincibles”, completing the League and FA Cup “Double” unbeaten in the inaugural season. A second division was formed in 1892 and membership of the Football League gradually expanded so that by the outbreak of the First World War in 1914 there were 40 member clubs split equally into two divisions with automatic promotion and relegation between the two divisions. Gate attendances peaked at 12.5 million in the 1913/14 season. The Football League expanded rapidly in the years immediately after the First World War with the incorporation of the Southern League as Division 3 in 1920 and the creation of a Division 3 (North) and Division 3 (South) the following years which increased the membership to 88 clubs by 1923. Total gate attendances reached 27.9 million in season 1937/38.

Gate attendances sharply increased after the Second World War, reaching a record 41.3 million in season 1948/49 which equated to around one million fans attending Football League matches on Saturday afternoons. Although the Football League expanded its membership to its current level of 92 clubs in 1950 and reorganised the two regionalised divisions into Division 3 and Division 4 in 1958, a long-term decline in attendances had set in with attendances falling steadily from the 1950s until the mid-1980s with the exception of a brief reversal of fortune in the late 1960s attributed to a renewed love of the beautiful game after England’s 1966 World Cup victory. The decline bottomed out in 1985/86 when Football League attendances fell to only 16.5 million which represented a 60.0% decrease from the peak in 1948/49. Thereafter the story has been one of continued growth, accelerated in part by the declaration of independence of the top division in 1992 with the formation of the FA Premier League. By last season (2022/23), league attendances in the top four tiers of English football had reached 34.8 million, a level last attained in season 1954/55 – quite an incredible turnaround.

The U-shaped pattern in total league attendances since the end of the Second World War is also evident but less clearly so if we focus only on the top division (see Figure 2). In particular, the post-1966 World Cup effect is much more noticeable with attendances rising from 12.5 million in 1965/66 to 15.3 million in 1967/68 and remaining above 14 million until 1973/74, and thereafter declining to a low of 7.8 million in 1988/89. Interestingly, given that league attendances in the top division account for 40% – 50% of total attendances for the top four divisions, it is somewhat anomalous that the recovery in attendances in the top division seems to have lagged around three years behind the rest of the Football League. However, part of the explanation is the changes in the number of clubs in the top division during that period. There were 22 clubs in the top division from 1919/20 to 1986/87 but this was reduced to 21 clubs in 1987/88 and 20 clubs in 1988/89 before returning to 22 clubs in 1991/92 with the current divisional structure of a 20-club Premier League and three 24-club divisions in the Football League dating from 1995.

Figure 2: League Attendances, Top Division, England, 1946-2023

Given the variations in the number of matches with spectators in the top division across time due to the changes in the number of clubs as well as the effects of the pandemic on total attendances in the 2019/20 season, it is more useful to compare average league gates (see Figure 3). The average gate at top division matches peaked at 38,776 in 1948/49 and declined to a low of 18,856 in 1983/84 (which leads the nadir of total Football League attendances by two years). The rapid growth in Premier League attendances occurred between 1993 and 2003 with the average gate of 21,125 in 1992/93, the first season of the Premier League, increasing by 67.8% over the next 10 years to an average gate of 35,445 in 2002/03. Growth has continued thereafter so that the average gate in the Premier League reached 40,229 in 2022/23, an historical high since the formation of the Football League and 3.7% above the previous record average gate set in 1948/49.

So to answer the question I posed at the start of the post – the top tier of English league football has never been more popular as measured by gate attendances on a per match basis, and the rest of the Football League has a level of popularity not experienced since the 1950s. England has rediscovered its love of the beautiful game since the mid-1980s and not just Premiership football. And that is before considering the explosive growth in TV coverage of English league football both domestically and internationally. But that, as they say, is another ball game entirely.

Figure 3: Average Gate, Top Division, England, 1946-2023