Executive Summary
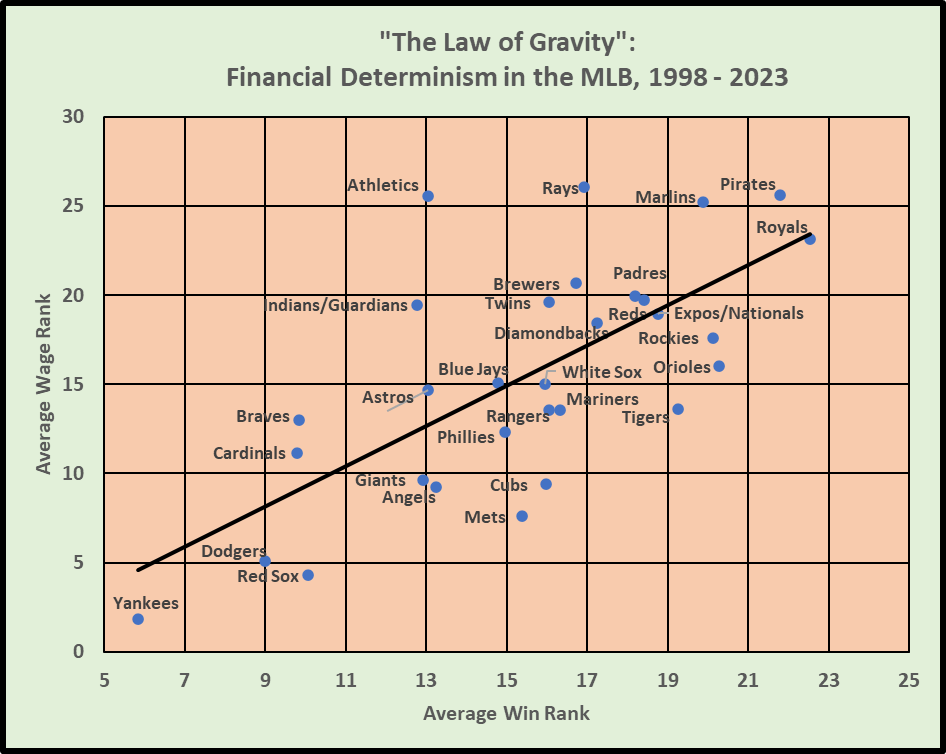
- Moneyball is principally a baseball story of using data analytics to support player recruitment
- But the message is much more general on how to use data analytics as an evidence-based approach to managing sporting performance as part of a David strategy to compete effectively against teams with much greater economic power
- The last twenty years have seen the generalisation of Moneyball both in its transferability to other team sports and its applicability beyond player recruitment to all other aspects of the coaching function particularly tactical analysis
- There are two key requirements for the effective use of data analytics to manage sporting performance: (1) there must be buy-in to the usefulness of data analytics at all levels; and (2) the analyst must be able to understand the coaching problem from the perspective of the coaches, translate that into an analytical problem, and then translate the results of the data analysis into actionable insights for the coaches
Moneyball is principally a baseball story of using data analytics to support player recruitment. But the message is much more general on how to use data analytics as an evidence-based approach to managing sporting performance as part of a David strategy to compete effectively against teams with much greater economic power. My interest has been in generalising Moneyball both in its transferability to other team sports and its applicability beyond player recruitment to all other aspects of the coaching function particularly tactical analysis.
The most obvious transferability of Moneyball is to other striking-and-fielding sports, particularly cricket. And indeed cricket is experiencing an analytics revolution akin to that in baseball stimulated in part by the explosive growth of the T20 format in the last 20 years especially the formation of the Indian Premier League (IPL). Intriguingly, Billy Beane himself is now involved with the Rajasthan Royals in the IPL. Cricket analytics is an area in which I am now taking an active interest and on which I intend to post regularly in the coming months after my visit to the Jio Institute in Mumbai.
My primary interest in the transferability and applicability of Moneyball has been with what I call the “invasion-territorial” team sports that in one way or another seek to emulate the battlefield where the aim is to invade enemy territory to score by crossing a defended line or getting the ball into a defended net. The various codes of football – soccer, rugby, gridiron and Aussie Rules – as well as basketball and hockey are all invasion-territorial team sports. (Note: hereafter I will use “football” to refer to “soccer” and add the appropriate additional descriptor when discussing other codes of football.) Unlike the striking-and-fielding sports where the essence of the sport is the one-on-one contest between the batter and pitcher/bowler, the invasion-territorial team sports involve the tactical coordination of players undertaking a multitude of different skills. So whereas the initial sabermetric revolution at its core was the search for better batting and pitching metrics, in the invasion-territorial team sports the starting point is to develop an appropriate analytical model to capture the complex structure of the tactical contest involving multiple players and multiple skills. The focus is on multivariate player and team performance rating systems. And that requires detailed data on on-the-field performance in these sports that only became available from the late 1990s onwards.
When I started to model the transfer values of football players in the mid-90s, the only generally available performance metrics were appearances, scoring and disciplinary records. These worked pretty well in capturing the performance drivers of player valuations and the statistical models achieved goodness of fit of around 80%. I was only able to start developing a player and team performance rating system for football in the early 2000s after Opta published yearbooks covering the English Premier League (EPL) with season totals for over 30 metrics for every player who had appeared in the EPL in the four seasons, 1998/99 – 2001/02. It was this work that I was presenting at the University of Michigan in September 2003 when I first read Moneyball.
My player valuation work had got me into the boardrooms and I had used the same basic approach to develop a wage benchmarking system for the Scottish Premier League. But getting into the inner sanctum of the football operation in clubs proved much more difficult. My first success was to be invited to an away day for the coaching and support staff at Bolton Wanderers in October 2004 where I gave a presentation on the implications of Moneyball for football. Bolton under their head coach Sam Allardyce had developed their own David strategy – a holistic approach to player management based on extensive use of sport science. I proposed an e-screening system of players as a first stage of the scouting process to allow a more targeted approach to the allocation of Bolton’s scarce scouting resources. Pleasingly, Bolton’s Performance Director thought it was a great concept; disappointingly he wanted it to be done internally. It was a story repeated several times with both EPL teams and sport data providers – interest in the ideas but no real engagement. I was asked to provide tactical analysis for one club on the reasons behind the decline in their away performances but I wasn’t invited to present and participate in the discussion of my findings. I was emailed later that my report had generated a useful discussion but I needed more specific feedback to be able to develop the work. It was a similar story with another EPL club interested in developing their player rating system. Again the intermediaries presented my findings and the feedback was positive on the concept but then set out the limitations which I had listed in my report, all related to the need to use more detailed data than that with which I had been provided. Analytics can only be effective when there is meaningful engagement between the analyst and the decision-maker.
The breakthrough in football came from a totally unexpected source – Billy Beane himself. Billy had developed a passion for football (soccer) and the Oakland A’s ownership group had acquired the Earthquakes franchise in Major League Soccer (MLS). Billy had found out about my work in football via an Australian professor at Stanford, George Foster, a passionate follower of sport particularly rugby league. Billy invited me to visit Oakland and we struck up a friendship that lasts to this day. As an owner of a MLS franchise, Oakland had access to performance data on every MLS game and, to cut a long story short, Billy wanted to see if the Moneyball concept could be transferred to football. Over the period 2007-10 I produced over 80 reports analysing player and team performance, investigating the critical success factors (CSFs) for football, and developing a Value-for-Money metric to identify undervalued players. We established proof of concept but at that point the MLS was too small financially to offer sufficient returns to sustain the investment needed to develop analytics in a team. I turned again to the EPL but with the same lack of interest as I had encountered earlier. The interest in my work now came from outside football entirely – rugby league and rugby union.
The first coach to take my work seriously enough to actually engage with me directly was Brian Smith, an Australian rugby league coach. I spent the summer of 2005 in Sydney as a visiting academic at UTS. I ran a one-day workshop for head coaches and CEOs from a number of leading teams mainly in rugby league and Aussie Rules football. One of the topics covered was Moneyball. Brian Smith was head coach of Paramatta Eels and had developed his own system for tracking player performance. Not surprisingly, he was also a Moneyball fan. Brian gave me access to his data and we had a very full debrief on the results when Brian and his coaching staff visited Leeds later that year. It was again rugby league that showed real interest in my work after I finished my collaboration with Billy Beane. I met with Phil Clarke and his brother, Andrew, who ran a sport data management company, The Sports Office. Phil was a retired international rugby league player who had played most of his career with his hometown team, Wigan. As well as The Sports Office, Phil’s other major involvement was with Sky Sports as one of the main presenters of their rugby league coverage. I worked with Phil in analysing a dataset he had compiled on every try scored in Super League in the 2009 season and we presented these results to an industry audience. Subsequently, I worked with Phil in developing the statistical analysis to support the Sky Sports coverage of rugby league including an in-game performance gauge that included a traffic-lights system for three KPIs – metres gained, line breaks and tackle success – as well as predicting what the points margin should be based on the KPIs.
But Phil’s most important contribution to my development of analytics with teams was the introduction in March 2010 to Brendan Venter at Saracens in rugby union. Brendan was a retired South African international who had appeared as a replacement in the famous Mandela World Cup Final in 1995. He had taken over as the Director of Rugby at Saracens at the start of the 2009/10 season and instituted a far-reaching cultural change at the club, central to which was a more holistic approach to player welfare and a thorough-going evidence-based approach to coaching. Each of the coaches had developed a systematic performance review process for their own areas of responsibility and the metrics generated had become a key component of the match review process with the players. My initial role was to develop the review process so that team and player performance could be benchmarked against previous performances. A full set of KPIs were identified with a traffic-lights system to indicate excellent, satisfactory and poor performance levels. This augmented match review process was introduced at the start of the 2010/11 season and coincided with Saracens winning the league title for the first time in their history. The following season I was asked by the coaches to extend the analytics approach to opposition analysis, and the sophistication of the systems continued to evolve over the five seasons that I spent at Saracens.
I finished at Saracens at the end of the 2014/15 season although I have continued to collaborate with Brendan Venter on various projects in rugby union over the years. But just as my time with Saracens was ending, a new opportunity opened up to move back to football, again courtesy of Billy Beane. Billy had been contacted by Robert Eenhoorn, a former MLB player from the Netherlands, who is now the CEO of AZ Alkmaar in the Dutch Eredivisie. Billy had become an advisor to AZ Alkmaar and had suggested to Robert to get me involved in the development of AZ’s use of data analytics. AZ Alkmaar are a relatively small-town team that seek to compete with the Big Three in Dutch football (Ajax Amsterdam, PSV Eindhoven and Feyenoord) in a sustainable, financially prudent way. Like Billy, Robert understands sport as a contest and sport as a business. AZ has a history of being innovative, particularly in youth development with a high proportion of their first-team squad coming from their academy. I developed similar systems as I had at Saracens to support the first team with performance reviews and opposition analysis. It was a very successful collaboration which ended in the summer of 2019 with data analytics well integrated into AZ’s way of doing things.
Twenty years on, the impact of Moneyball has been truly revolutionary. Data analytics is now an accepted part of the coaching function in most elite team sports. But teams vary in the effectiveness with which they employ data analytics particularly in how well it is integrated into the scouting and coaching functions. There are still misperceptions about Moneyball especially in regard the extent to which data analytics is seen as a substitute for traditional scouting methods rather than being complementary. Ultimately an evidence-based approach is about using all available evidence effectively, not just quantitative data but also qualitative expert evaluations of coaches and scouts. Data analytics is a process of interrogating all of the data.
So what are the lessons from my own experience of the transferability and applicability of Moneyball? I think that there are two key lessons. First, it is crucial that there is buy-in to the usefulness of data analytics at all levels. It is not just leadership buy-in. Yes, the head coach and performance director must promote an evidence-based culture but the coaches must also buy-in to the analytics approach for any meaningful impact on the way things actually get done. And, of course, players must buy-in to the credibility of the analysis if it is to influence their behaviour. Second, the analyst must be able to understand the coaching problem from the perspective of the coaches, translate that into an analytical problem, and then translate the results of the data analysis into actionable insights for the coaches. There will be little buy-in from the coaches if the analyst does not speak their language and does not respect their expertise and experience.
Read Other Related Posts